NASDAQ 100 (QQQ) Technical Analysis And Trade Levels

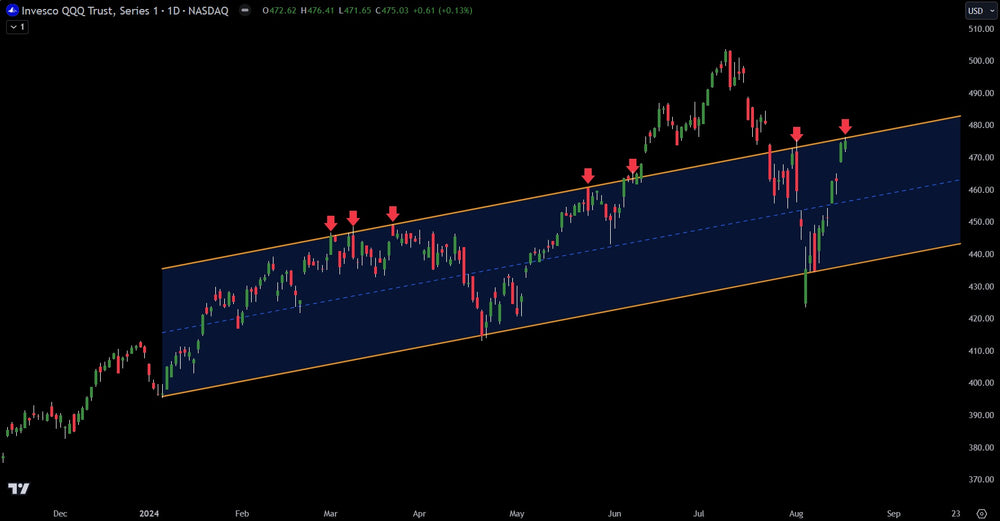
The Invesco QQQ Trust (QQQ) has surged in the last two weeks. After bottoming out on August 5th at $424, it has rallied 12%. While impressive, the real test starts in the coming days.
From a technical analysis angle, the QQQ has moved into a perfect parallel line of resistance. This can be seen in the chart above. Major components of the NASDAQ 100 are also into major resistance. Nvidia (NVDA) has jumped 35% from recent lows and is now nearing a major resistance level (gap fill) at $126.35.
From a market psychology angle, investors went from panic to euphoria in two weeks. The VIX has dropped from 65 to 14. This shows complacency again and can be used as a contrarian indicator.
Overall, this level on the QQQ is a major test for bulls and bears. Should price continue higher, all-time highs become very likely. However, if the NASDAQ 100 stalls and starts dropping, by end of year, new lows are likely.
Trading involves substantial risk. All content is for educational purposes only and should not be considered financial advice or recommendations to buy or sell any asset. Read full terms of service.


