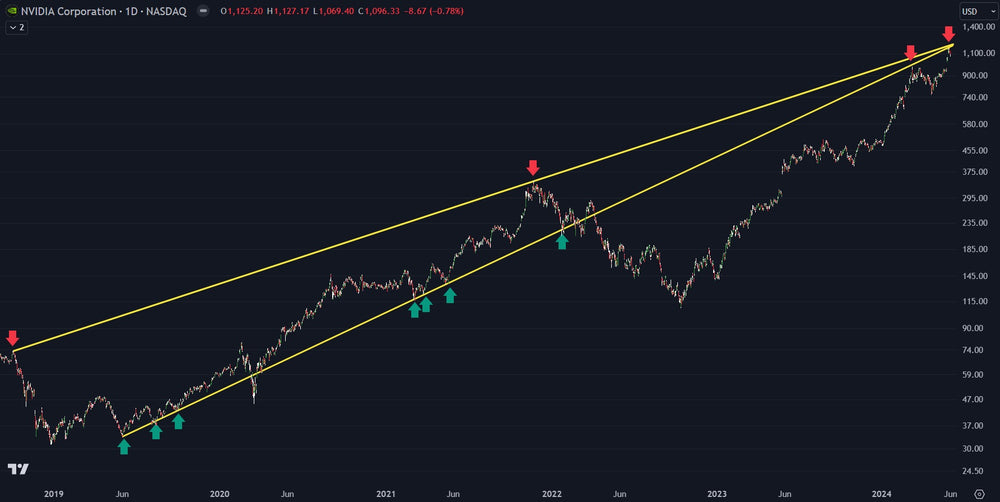
Nvidia Potential Top: Logarithmic Chart Analysis

Logarithmic charts are generally used in assets that go parabolic. Historically, they are not common in the stock market or commodity market because these move slower. In the crypto markets, logarithmic charts are much more common as gains of 1000% or more are somewhat common.
Nvidia Corp. (NVDA) has been an incredible runner. In fact, the chart does resemble a crypto chart based on its parabolic nature. While it is hard to find trend lines that actually are applicable in linear charting, logarithmic charts do show us something intriguing.
When flipping Nvidia to the log chart, there are two trend lines that start back as far 2019 and connect through multiple pivot highs and lows. Both these trend lines converge at the recent all-time high on Nvidia.
While this does not guarantee a top, it certainly shifts probabilities to a pull back and perhaps more. The chart above shows these trend lines via log chart.
Trading involves substantial risk. All content is for educational purposes only and should not be considered financial advice or recommendations to buy or sell any asset. Read full terms of service.


