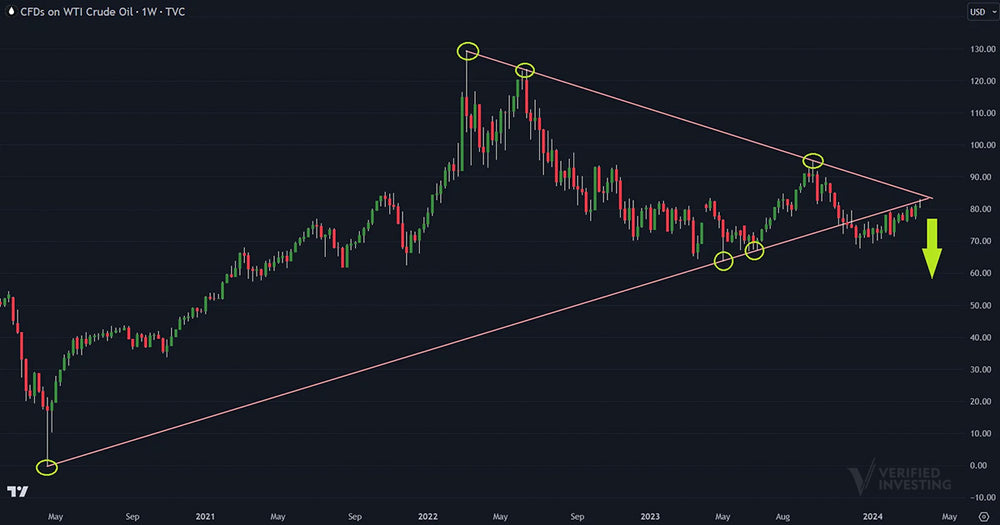
Oil Chart Signals Downside And Recession Ahead

The spot crude oil chart is looking very bearish on the bigger time frames. Oil is consolidating in a bear flag below two MAJOR trend lines. It looks like oil is capped in the near-term at $83-$85/bbl. In addition, should this weekly chart break down (as the bear flag indicators, oil could be headed sharply lower to the $60 level.
For the bearish nature of the chart to flip bullish, price must get above and hold above $85 for a full week. If that does not happen, probabilities strongly favor the downside, and likely soon.
Trading involves substantial risk. All content is for educational purposes only and should not be considered financial advice or recommendations to buy or sell any asset. Read full terms of service.


