Palantir (PLTR) Nears Major Resistance, Negative RSI Divergence
Palantir Technologies (PLTR) has been on a tear, rewarding long investors with a remarkable surge of over 80% in less than a month. However, after such a powerful ascent, the stock is now approaching a significant technical challenge zone that warrants close attention, potentially signaling a prime opportunity for swing traders looking for a short-term pullback.
Analyzing the Daily Chart
A closer look at Palantir's daily price chart reveals several converging technical factors suggesting the rally may be losing steam:
-
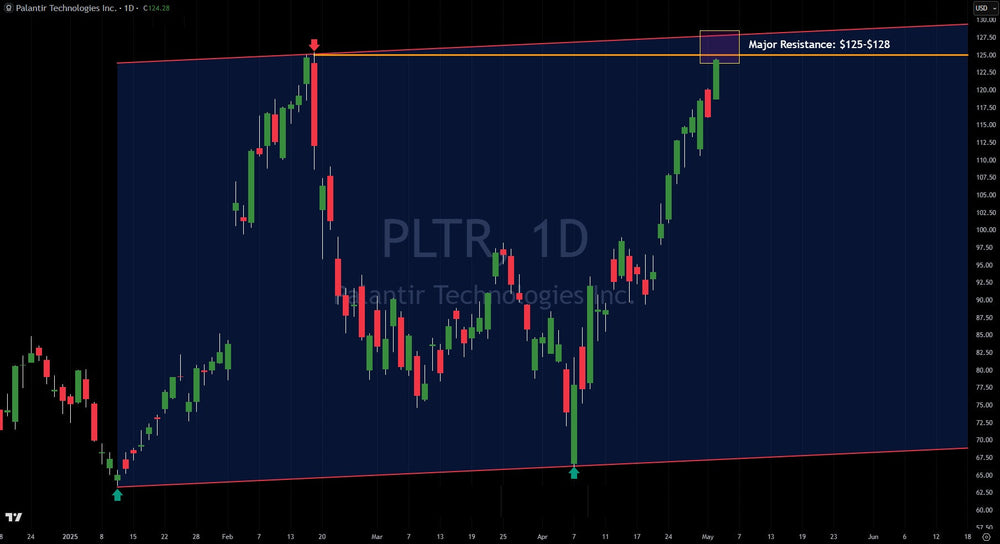
The Parallel Channel: Since late January 2025, PLTR's price action has been largely contained within a well-defined upward-sloping parallel channel. The stock has respected both the lower support line and the upper resistance line multiple times. Currently, the price is nearing the upper boundary of this channel. Price should get rejected here.
-
Major Horizontal Resistance: A clear horizontal resistance zone exists at $125. This area previously halted the stock's advance back in mid-February 2025. The price is now retesting this critical ceiling. This is known in technical analysis as a double top.
-
Confluence Creates a Barrier: The most compelling technical signal is the convergence occurring right now. The upper trendline of the parallel channel and the major horizontal resistance are intersecting. In technical analysis, such confluence zones often represent much stronger barriers than individual resistance levels, significantly increasing the probability of price rejection.
Beyond the chart patterns, context strengthens the case for a potential pullback:
-
Rapid Gains: Stocks rarely sustain gains of over 80% in such a short period without pausing or correcting. The sheer speed and magnitude of PLTR's recent rally make it vulnerable to profit-taking, especially as it encounters strong resistance.
-
Weekly RSI Negative Divergence: Adding to the caution is the negative divergence on the weekly Relative Strength Index (RSI). While not visible on the provided daily chart, a weekly negative divergence (where price makes a new high but the RSI makes a lower high) is a significant warning sign. It indicates that the underlying momentum driving the price higher is weakening, often preceding a trend change or substantial pullback.
The High-Probability Short Zone
For swing traders, the convergence zone between $125 and $128 stands out as a high-probability area to consider initiating short positions. The confluence of channel resistance, horizontal resistance, the potential double top formation, the context of the sharp rally, and the reported weakening weekly momentum collectively signal that the risk/reward may be shifting in favor of the bears for a near-term move lower.


