QQQ Approaches Key Fibonacci 61.8% Retracement Level
The Invesco QQQ Trust (QQQ), which tracks the Nasdaq-100 Index, is showing a critical technical setup as it approaches a significant resistance level. After staging a recovery from its recent April low of approximately $410, QQQ has rallied nearly 18% to current levels around $484. This technical bounce has now brought the ETF directly into contact with a major technical barrier.
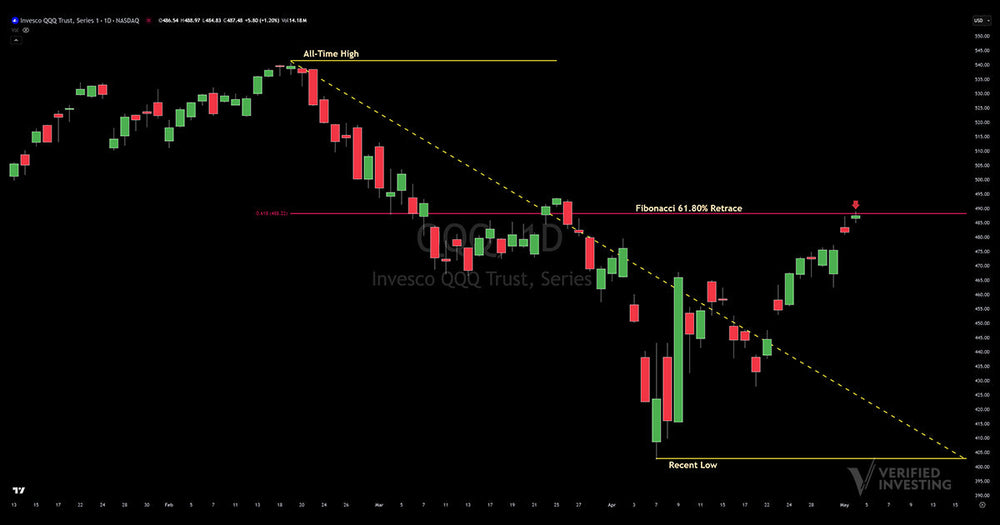
The most notable feature on the chart is the horizontal red line at the $488 level, which represents the 61.8% Fibonacci retracement of the move from the all-time high down to the recent low. This specific Fibonacci level is widely respected by institutional traders and often acts as significant resistance in bear market rallies. The most recent price action shows QQQ testing this level and facing immediate rejection, with the ETF forming a bearish candle precisely at this resistance point.
Adding to the technical significance is the descending trend line (yellow dashed line) that connects the all-time high with subsequent lower highs throughout 2025. This declining resistance has capped rallies consistently since the market peaked, creating a series of lower highs that defines the current downtrend. The confluence of this descending trend line with the 61.8% Fibonacci retracement level creates a formidable resistance zone that will likely require substantial buying pressure to overcome. Traders should watch for potential reversal signals around the $488 level, with a decisive break above potentially signaling a change in trend, while rejection could trigger another move toward the $450 support area.


