
S&P 500 Flashes Bearish Signals: Head and Shoulders Pattern Emerges
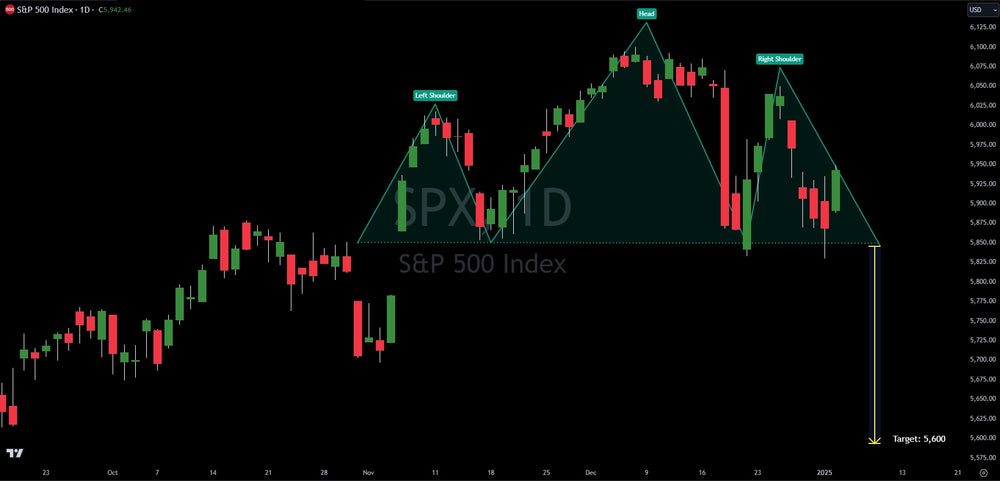
The S&P 500 is exhibiting a classic head and shoulders pattern on the daily chart, a bearish indicator that suggests a potential trend reversal. This pattern typically triggers a sell-off when the price breaks below the neckline, currently sitting around 5,850. If this support level gives way, we could see a decline to the calculated target of 5,600.
Adding to the bearish outlook, several warning signs are flashing red:
- Overvalued Market: Valuations are reaching extreme highs, making the market susceptible to a correction.
- Overbought Conditions: Technical indicators are signaling overbought conditions, suggesting that the upward momentum is waning.
- Weakening Breadth: Market breadth, as measured by the advance-decline ratio, remains weak, indicating that fewer stocks are participating in the rally.
- Dow's Downward Streak: The Dow Jones Industrial Average recently experienced its longest streak of down days since the 1970s, another sign of underlying weakness.
Swing Trading Strategy:
For swing traders, the current strategy favors shorting the S&P 500. However, if the index breaks out to new all-time highs, it would invalidate this bearish outlook and signal a continuation of the uptrend.
This article is intended for informational and educational purposes only and does not constitute financial advice. All trading involves risk. Past performance is not indicative of future results. Trading involves substantial risk. All content is for educational purposes only and should not be considered financial advice or recommendations to buy or sell any asset.
Trading involves substantial risk. All content is for educational purposes only and should not be considered financial advice or recommendations to buy or sell any asset. Read full terms of service.


