S&P 500 Rounded Top Signals Distribution Phase as AI Sector Rotation Unfolds
The stock market is sending increasingly cautious signals beneath the surface, even as the S&P 500 remains near all-time highs. A growing divergence between software stocks and semiconductor names is reshaping the near-term AI trade, and the technical evidence suggests a meaningful rotation may be underway.
The S&P 500: Ominous Structure at All-Time Highs
Despite persistent retail bullishness over the past three to four months, the S&P 500 has failed to make meaningful upside progress. This stall at elevated levels reflects a dynamic known as distribution — where institutional participants use retail buying demand as an exit opportunity, quietly reducing exposure while smaller investors continue to add.
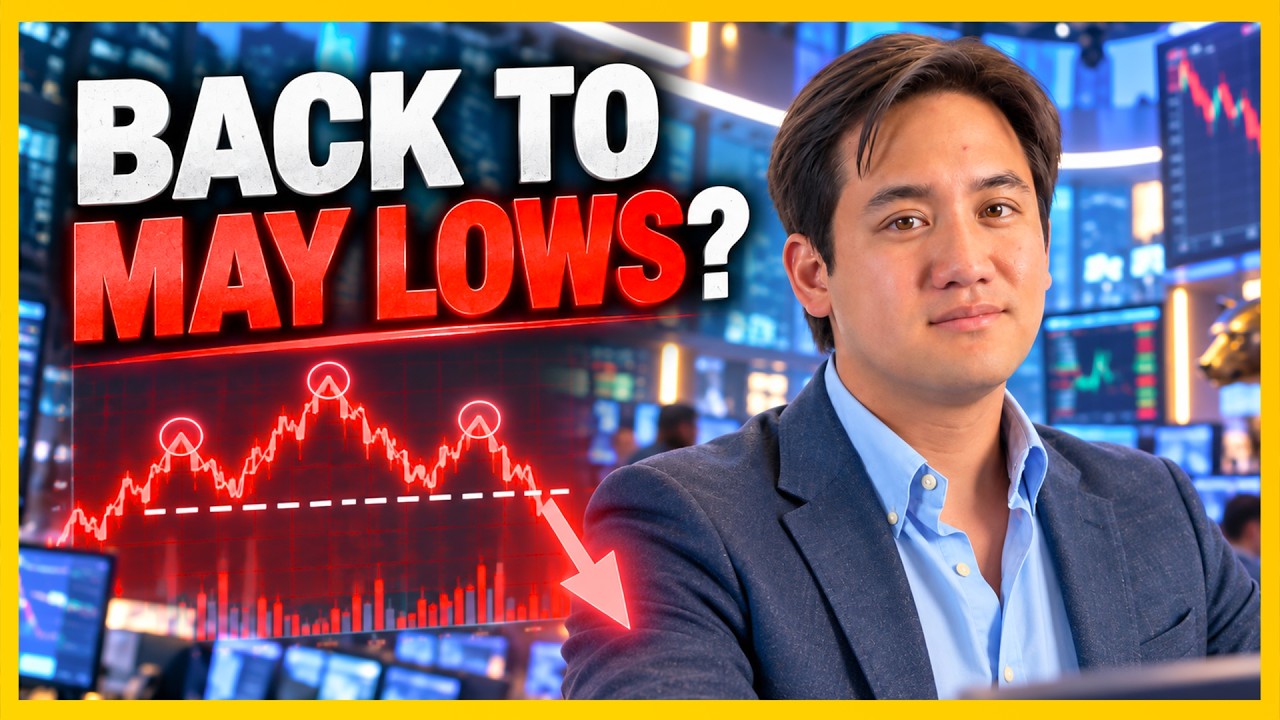
On the chart, this behavior is visible in a rounded top formation. Following a sharp vertical advance, the index has begun to curve, losing momentum without a decisive breakdown. A head and shoulders pattern has also emerged within this structure, with the neckline sitting near 6,790 on the S&P 500. A confirmed break below that level would trigger a measured move to approximately 6,550 — a zone that aligns with prior pivot lows and established technical support.
A long-term parallel channel, anchored at the COVID low and the 2022 bear market low, continues to cap upside. Until a breakdown or decisive reclaim of this structure occurs, the broader bias remains cautious.
The Software vs. Semiconductor Divergence
The more actionable near-term story is a stark divergence between enterprise software stocks and semiconductor stocks within the AI sector.
Software Stocks: Oversold and Due for Relief
Names including Adobe, Oracle, Workday, Intuit, and CrowdStrike have experienced sharp, accelerated declines driven by fears that AI-native tools will displace traditional SaaS models. The selloff echoes the panic that hit chip stocks following the DeepSeek announcement earlier in 2025 — a sentiment-driven move that overshot to the downside. The technical case for a relief rally is building:
- Oracle has fallen to support levels last seen during the tariff-driven selloff. A technical bounce toward $185 appears probable from the current support zone.
- Workday is approaching major historical support near $115–$116, with trend line support extending back to 2014 highs. The $115–$129 range represents a viable accumulation zone.
- Intuit dropped from approximately $675 in early January to under $350 — nearly 50% — with RSI readings near 20, deeply oversold territory.
- Adobe has retreated to price levels last seen in 2018, reflecting years of gains erased in a short period.
The near-term thesis on these names is a technical bounce of 10–25% over the next three to six weeks — not a long-term structural recovery, but a tactical opportunity where risk-reward is skewed to the upside.
Semiconductor Stocks: Extended and Approaching Risk
Chip stocks have remained near all-time highs on the narrative of insatiable AI demand, but technical analysis suggests this group is maturing in its uptrend.
- Taiwan Semiconductor (TSM) has encountered resistance at a key overhead level repeatedly. Probability analysis of parallel channel structures suggests the eventual resolution is typically a break to the downside.
- ASML is returning to a major rising trend line after consolidation, with downside pressure expected as that line is tested.
- Nvidia is approaching a critical juncture ahead of earnings. A potential head and shoulders pattern is visible on the chart — if the neckline breaks, the measured downside target is approximately $150.
Beyond AI-specific chips, memory and NAND-related names face a longer-term structural risk. These chips are not proprietary, and Chinese manufacturers are scaling production aggressively. The historical analog is the solar industry, where a Chinese manufacturing surge collapsed global pricing within a few years. A similar dynamic could suppress margins across non-proprietary semiconductor names over time.
Tactical Framework: The Pairs Trade
The near-term opportunity can be framed as a pairs trade: short the extended chip names while accumulating oversold software names for a technical bounce. Chip stocks appear vulnerable to a 10–20% pullback in the near term. Nvidia, given its stronger market position, represents a more moderate scenario of 10–20% downside from current levels, with greater risk in non-proprietary names.
Wednesday's Nvidia earnings report is the key near-term catalyst. The question is not whether results are strong — they are expected to be — but whether they exceed already elevated consensus estimates. A result that merely meets expectations could disappoint a market pricing in perfection.
Conclusion
The current environment rewards technical discipline over directional conviction. The S&P 500's rounded top argues for index-level caution, while within AI, a rotation appears to be forming — oversold software names reaching levels where probabilities favor relief, and extended chip stocks showing signs of distribution near resistance. As always, identifying where the thesis fails is as important as understanding where it succeeds. The charts continue to guide the process.
This article is intended for informational and educational purposes only and does not constitute financial advice. All trading involves risk. Past performance is not indicative of future results. Trading involves substantial risk. All content is for educational purposes only and should not be considered financial advice or recommendations to buy or sell any asset.
Trading involves substantial risk. All content is for educational purposes only and should not be considered financial advice or recommendations to buy or sell any asset. Read full terms of service.