
Technical Analysis On Apple (AAPL)
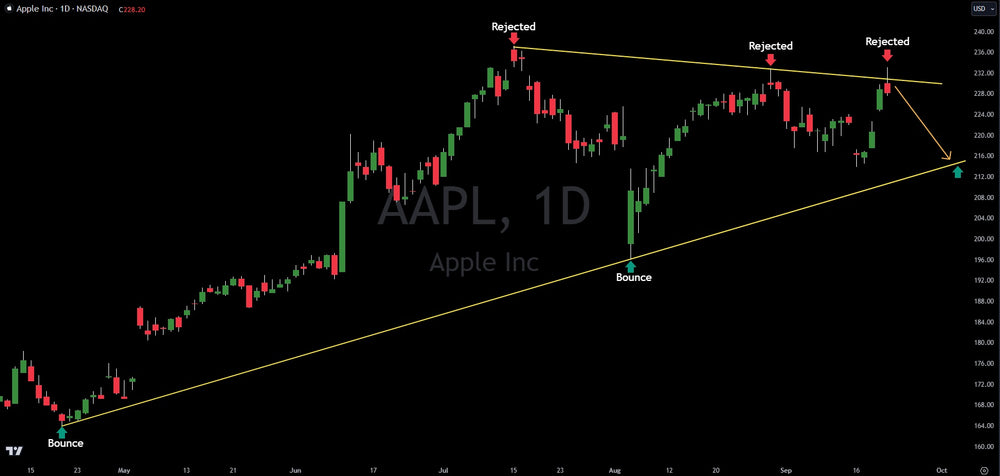
Apple Inc (AAPL) stock saw a sharp rally late in the week as investors went risk-on, following a 50 basis point rate cut from the Federal Reserve. However, Apple tried to break out of a wedge pattern on Friday, September 20th and failed. Price was rejected and ended the day below the breakout trend line. Note the chart above.
This means the wedge pattern is still intact and price may travel to the lower trend line of the wedge at $215.
Path of least resistance is down, possibly to the lower trend line as it has done multiple times in the past. However, if Apple has a daily close above $230, it will likely surge higher on the technical breakout. In fact, it would likely test the all-time highs.
Early in the week Apple saw downside on reports that the AI aspect of the iPhone 16 would not be available and this would severely hurt sales. However, the risk on animal spirits later in the week more than made up for the downside.
Eventually, sales, revenue and profits will matter to investors, but risk-on is a near-term powerful thing.
Per technical analysis, Apple may continue down in the near-term.
Verified Investing is a pure data and analysis firm. We realize most investors are bombarded with mainstream media narratives from CNBC, Fox Business, Bloomberg and insane hype from social media. Verified Investing gives investors the pure facts. No bs. The chart and data allow investors to get probability. Become the casino, avoid being the gambler.
This article is intended for informational and educational purposes only and does not constitute financial advice. All trading involves risk. Past performance is not indicative of future results. Trading involves substantial risk. All content is for educational purposes only and should not be considered financial advice or recommendations to buy or sell any asset.
Trading involves substantial risk. All content is for educational purposes only and should not be considered financial advice or recommendations to buy or sell any asset. Read full terms of service.


