The Chart That Predicted It All: Nasdaq Composite Parallel Channel
Technical analysis offers various tools for interpreting market movements, and sometimes, simple trendlines can provide compelling insights. One fascinating example involves using parallel trendlines on the Nasdaq Composite index to frame potential market turning points.
The Setup: Defining the Channel
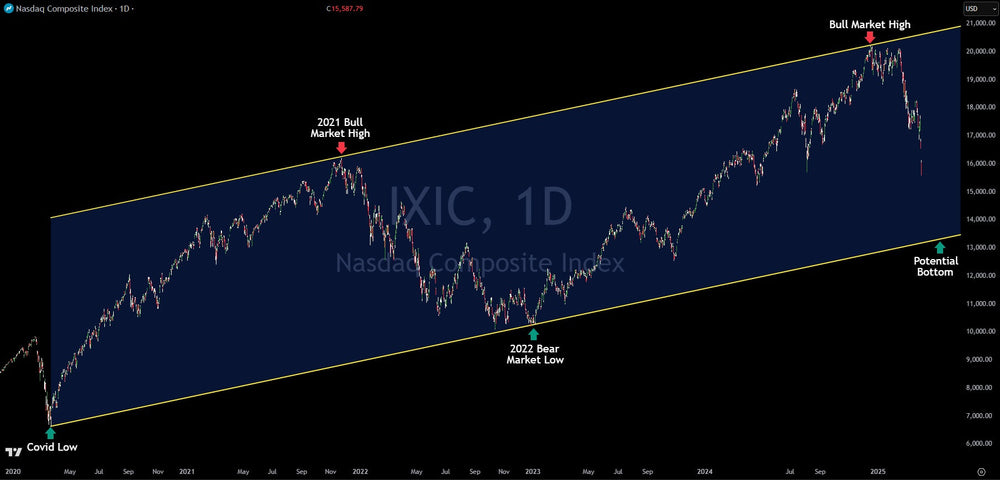
The analysis begins by establishing a primary uptrend line. This line connects two significant lows: the bottom reached during the COVID-19 market crash in March 2020 and the subsequent major low marking the end of the bear market phase in October 2022. This line represents a foundational level of support that held during that period.
Projecting Resistance: The Upper Parallel
Next, a parallel line is drawn or projected. This second line uses the same slope as the primary support line but is anchored to the peak of the 2021 bull market. According to this specific analysis, this upper parallel line acted as a significant resistance level, identifying the high of the bull market run that peaked more recently in December 2024. The idea is that the market's movement was contained within this defined parallel channel.
Projecting Support: A Potential Downside Target
If this parallel channel structure remains valid, the lower trendline (the one connecting the 2020 and 2022 lows) can be extended forward to project potential future support. Based on this methodology, a potential downside target for the Nasdaq Composite is identified around the 13,500 level.
Understanding the Implications
Reaching this 13,500 target would signify a substantial market correction, representing roughly a 33% decline from the previously mentioned peak. From the market levels referenced in the original analysis, this target would imply approximately 13% further downside.
Market Dynamics: Expect Volatility
It is crucial to emphasize that markets rarely move directly from one point to another. Even if the Nasdaq Composite trends towards the 13,500 target, significant bounces and counter-trend rallies are likely along the way. Market declines often occur in stages, with periods of selling followed by temporary relief rallies before the next leg down.
Conclusion: Logic, Probability, and Risk
This parallel trendline analysis presents a logical, chart-based scenario for a potential major support level on the Nasdaq Composite, suggesting a possible buying opportunity in technology stocks around the 13,500 mark.


