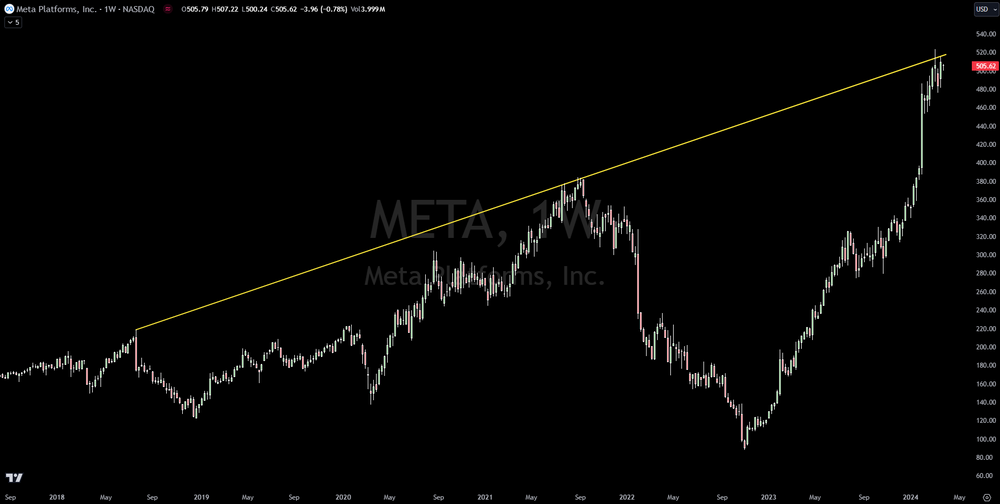
Trade It: META Hits Epic Trend Line Of Resistance

Meta Platforms, Inc. (META) has risen 466% since its lows in October of 2022. This epic run has seen no major pullbacks along the way. However, the chart is now showing significant resistance at the $520 level.
This level is the hit of a major trend line starting in 2018 and connecting through the 2021 highs. A trend line that goes back this far is usually major resistance and strongly favors a significant pull back in price.
Based on technical analysis and support levels, should Meta Platforms pull back in the coming weeks and months, the biggest support is the 2021 highs. This is at a price point of $385.
Trading involves substantial risk. All content is for educational purposes only and should not be considered financial advice or recommendations to buy or sell any asset. Read full terms of service.


