
UNH Stock Analysis: Key Support Level Signals Potential 18% Upside
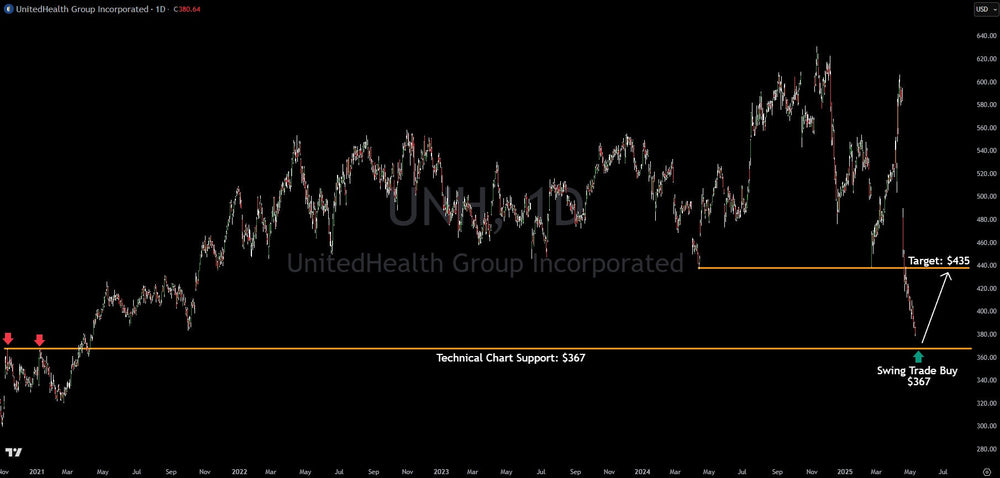
Summary: United Health Group (UNH) has fallen sharply in the last month, but now is approaching a technical support level at $367. The trend line of support comes from two pivot highs in November 2020 and January 2021. This was resistance that flipped into support. Swing traders may want to be on alert for a buy level there. The stock should see a bounce back to potentially as high as $435.
UnitedHealth Group (UNH): Finding Value at Historic Support Amid Earnings Pressure
In markets driven by fear and uncertainty, the most profitable opportunities often emerge precisely when others are heading for the exits. UnitedHealth Group (NYSE: UNH) appears to be presenting just such a scenario, as shares have retreated sharply to a critical technical support level following disappointing quarterly earnings and broader economic headwinds. Let's unpack what the chart is telling us and why this setback might actually represent a compelling swing trade opportunity.
The Power of Historical Support Zones
What immediately jumps out when examining UNH's multi-year chart is the remarkable significance of the $367 level. This isn't just any random price point – it's proven itself as a decisive battleground between bulls and bears on multiple occasions since mid-2021. Notice those two instances (marked by the red arrows) where price tested this exact region before launching into substantial rallies.
Markets have memory, and UNH's price action demonstrates this principle beautifully. That $367 zone has essentially functioned as a springboard, a level where big institutional buyers have consistently stepped in to accumulate shares. When a support level holds on multiple occasions across years of trading, it takes on increasing significance with each successful test.
Context Behind the Recent Decline
Before diving deeper into the technicals, let's address what's happening fundamentally. UNH's recent sharp decline wasn't random – it came on the heels of disappointing quarterly earnings amid an increasingly challenging economic environment for healthcare providers. The market's reaction was swift and decisive, sending shares tumbling down to test this critical support zone once again.
But here's where things get interesting from a contrarian perspective: while headlines and sentiment turn negative, the technical picture suggests we've reached a level where risk/reward dynamics start shifting favorably for potential buyers. This disconnect between sentiment and technical structure often creates the most profitable trading opportunities.
The Technical Case for a Bounce
What makes the current setup particularly compelling is how precisely price has respected that $367 level once again. After the earnings-induced selloff, we've seen the stock stabilize right at this established support zone – almost as if the market collectively recognizes its historical significance. The price action is exhibiting the classic signs of seller exhaustion as we hover near support.
When a stock falls dramatically and then begins to consolidate at a known support level, it often indicates that most of the selling pressure has been absorbed. Think of it like a spring that's been compressed – the further it's pushed down, the more potential energy builds for an eventual rebound.
The chart clearly lays out the objective: a measured move back toward the $435 target level. This isn't an arbitrary number – it represents a logical technical objective based on previous price behavior and the magnitude of the recent decline. The white arrow visually captures this anticipated move from the current support zone back toward this resistance level.
A Swing Trader's Perspective
From a swing trading standpoint, this setup offers what experienced traders constantly seek: clearly defined entry points, targets, and risk levels. The notation "Swing Trade Buy $367" on the chart isn't subtle about the opportunity being presented. Let's break down what makes this potentially attractive:
-
Defined Entry Zone: The $367 area provides a precise level for establishing positions, with the benefit of aligning with proven historical support.
-
Clear Target: The $435 level gives us a concrete objective, representing approximately an 18% potential upside from the entry zone.
-
Favorable Risk/Reward: With a stop-loss potentially placed just below the $367 support (perhaps around $360), the risk-to-reward ratio becomes highly attractive – potentially risking 2% to gain 18%.
-
Contrarian Opportunity: We're entering when sentiment is negative following earnings disappointment – often the best time to establish positions before institutional money begins accumulating again.
The Broader Context: Multi-Year Perspective
Zooming out to appreciate the bigger picture, we can see that UNH has demonstrated tremendous resilience over the 2021-2025 period covered in our chart. Despite multiple pullbacks, the stock has maintained a generally constructive long-term structure with higher highs and higher lows across most of the timeframe.
The current pullback, while significant, hasn't violated any major long-term uptrend characteristics. Instead, it appears to be a reasonable retracement within the context of the stock's broader trading history. This perspective helps separate emotional reactions to recent weakness from the objective technical reality of where we stand.
Volume Considerations and Validation Signs
While not explicitly marked on the chart, volume characteristics would be worth monitoring closely for confirmation of this potential bottoming process. What would strengthen the case for a rebound? Look for declining volume on any further weakness near support (suggesting waning selling pressure) followed by above-average volume on up days (indicating new buying interest).
Additionally, traders should watch for early signs of relative strength compared to the broader healthcare sector or market indices. If UNH begins outperforming its peers or the market after this test of support, it would provide additional validation that smart money is accumulating positions at these levels.
Risk Considerations: What Could Invalidate This Setup?
No technical setup is without risk, and intellectual honesty demands acknowledging what could go wrong. The most obvious invalidation would be a decisive break and close below the $367 support level, especially on high volume. Such a development would suggest that the historical support is finally giving way and would likely lead to further downside.
Additionally, if broader market conditions significantly deteriorate, even strong technical setups can fail. Healthcare stocks, while generally defensive, aren't immune to severe market-wide corrections. Always consider the broader market context when establishing positions.
The Bottom Line
UnitedHealth Group presents a compelling technical opportunity as it tests a proven support level following an earnings-driven decline. The clear technical structure, with well-defined support, upside target, and historical precedent for rebounds from this exact level, creates a favorable risk/reward scenario for swing traders.
While poor quarterly results and economic challenges have created the current pressure, history suggests that buying when others are fearful – especially at established technical support levels – often rewards the patient, disciplined trader. As always, proper position sizing and stop-loss implementation remain crucial, but the technical case for a potential move toward $435 appears well-supported by the chart evidence before us.
What we're watching for now is simple: stabilization and early signs of buying interest near this support zone that could trigger the beginning of the anticipated move higher. For those with appropriate risk tolerance, this setup offers a textbook opportunity to potentially profit from the gap between current negative sentiment and the objective technical structure that suggests better days ahead.
This article is intended for informational and educational purposes only and does not constitute financial advice. All trading involves risk. Past performance is not indicative of future results. Trading involves substantial risk. All content is for educational purposes only and should not be considered financial advice or recommendations to buy or sell any asset.
Trading involves substantial risk. All content is for educational purposes only and should not be considered financial advice or recommendations to buy or sell any asset. Read full terms of service.


