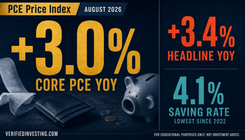
PCE June 2026: The Headline Dropped — Core Didn't Fall Far Enough

Published by Verified Investing | U.S. Economic Metrics Released: July 30, 2026 | Data Period: June 2026 | Source: U.S. Bureau of Economic Analysis
Key Takeaways
- Headline PCE fell -0.11% MoM — energy price declines dragged the top-line number negative, but that move tells you almost nothing about underlying inflation pressure.
- Core PCE rose +0.13% MoM, slowing from May's +0.33%, and sits at 3.29% YoY — still 129 basis points above the Fed's 2% target on the measure it watches most closely for underlying inflation.
- YoY core decelerated from 3.42% to 3.29% — directionally correct, but the pace of descent is 13 basis points per month. That does not get to 2% in 2026.
- Headline PCE YoY dropped from 4.08% to 3.67%, driven by the same energy move that flattered the MoM print — not a signal of broad disinflation.
- Personal spending rose +0.29% MoM against income growth of +0.20% MoM — consumers are still outspending their income gains, which supports continued demand-side price pressure.
- Core PCE has been above 3% for an extended stretch, and the gap between core and target is roughly what it was a year ago. The disinflationary trend has stalled, not accelerated.
- 2026 rate cuts are out of the base case. The new Fed Chair assumes command of a 3.29% core PCE economy with no clear mechanism for rapid disinflation.
What This Metric Measures, and Why This Print Matters
The PCE Price Index is the Federal Reserve's preferred inflation gauge. Core PCE — which strips out food and energy — is the measure the Fed watches most closely to judge underlying inflation pressure. That distinction matters right now because CPI has captured most of the public narrative, and the two indexes have occasionally told different stories in recent months.
PCE uses a chain-weighted methodology that adjusts for consumer substitution, and it weights shelter lower and healthcare higher than CPI. A PCE print can look softer than an equivalent CPI print in the same month — occasionally creating the impression of more progress than the Fed's own framework confirms.
The June 2026 print lands at a pivotal moment. Kevin Warsh took over as Fed Chair on May 15. Markets have been pricing a rate-cut timeline on the assumption that PCE would continue drifting lower toward 2%. Today's number tests that thesis. The short answer: the thesis survives, but barely. Core PCE is moving in the right direction. The pace is too slow to support a 2026 cut, and the headline number's negativity is almost entirely an energy artifact.
What Everyone Will Focus On vs. What Matters More
The dominant market read will be the negative headline PCE MoM print — -0.11%. Headline PCE going negative reads as a disinflationary win, and some coverage will frame this as evidence the Fed's work is nearly done. That read is wrong.
The headline went negative because energy prices fell. Energy is volatile. It does not tell the Fed whether the structural inflation problem — services, shelter, core goods — is resolving. The Fed knows this. The Fed looks at core.
Core PCE at +0.13% MoM is genuinely better than May's +0.33%. But one soft month inside an elevated regime does not break the regime. Here's the math the press line will underplay: a 0.13% monthly pace, annualized, is roughly 1.6%. A 0.33% monthly pace annualized is closer to 4%. One month at the lower pace does not offset the prior trend — and the YoY rate, which smooths this volatility, is still 3.29%. That is 129 basis points above where the Fed needs it.

What matters more than the headline drop: the YoY deceleration rate. Core PCE has come down from 3.42% in May to 3.29% in June — a 13-basis-point move. The prior move, April to May, was similarly modest. The disinflationary path is intact, but it is not accelerating. At this pace of descent, the Fed does not see 2% core PCE this year. That keeps 2026 cuts out of the base case more decisively than the negative headline print reopens them.
The Energy Distortion — and What's Under It
Headline PCE fell -0.11% MoM. Core PCE rose +0.13% MoM. The gap between those two numbers is almost entirely food and energy, with energy doing the heavy lifting on the downside.
This is the same dynamic that inflated May's headline number (+0.46% MoM against core's +0.33%). Energy was the culprit in both directions. Brent crude has pulled back from its May peak of $115.30 as Iran-war risk premium has partially compressed. When crude falls, gasoline and energy services prices fall in the PCE basket. The headline responds immediately. Core does not.
The takeaway is mechanical, not analytical: June's negative headline print is an energy story. It does not mean consumers are experiencing broad-based price relief. It means gasoline got cheaper. If crude stabilizes or bounces next month, headline PCE reverses — and any "disinflation is here" narrative built on June's -0.11% looks premature.

The core ex-energy picture is where the actual work of disinflation has to happen. At +0.13% MoM, June showed that work is progressing. It is not done.
The Spending-Income Gap
Personal income rose +0.20% MoM in June. Personal spending rose +0.29% MoM. Consumers are outrunning their income gains in nominal spending — and that gap keeps demand-side inflation pressure alive.
Disinflation requires either supply normalization, demand cooling, or both. Supply normalization is happening in some goods categories. Demand has not cooled on a sustained basis. The spending-income gap in June is not large in isolation, but it represents a pattern: the consumer who was drawing down savings to fund spending earlier this year has not stopped spending. Nothing in June's PCE changed that.
As long as nominal spending growth exceeds income growth, services inflation has a demand floor. That is not the profile of an economy moving quickly back to 2% core.
The YoY Trajectory
| Metric | May 2026 | June 2026 | Change | |---|---|---|---| | Headline PCE, MoM | +0.46% | -0.11% | −57 bps | | Core PCE, MoM | +0.33% | +0.13% | −20 bps | | Headline PCE, YoY | +4.08% | +3.67% | −41 bps | | Core PCE, YoY | +3.42% | +3.29% | −13 bps | | Personal Income, MoM | — | +0.20% | — | | Personal Spending, MoM | — | +0.29% | — |
The headline YoY moved 41 basis points in one month — a large swing. The swing is energy. Core YoY moved 13 basis points. That is the authentic disinflationary signal, and it is real but slow.
A useful frame: if core PCE falls another 13 basis points in July — to roughly 3.16% — the trajectory is intact. If July prints flat or moves higher, the gradual disinflation narrative cracks. One soft month like June does not establish a new trend. It interrupts the prior trend. Interruption and trend-break are different things. The August release will tell you which this was.
What This Means For Traders
The following is provided for educational purposes only and does not constitute investment advice.
The rate-cut story just got harder, not easier. Bond markets will likely rally on the negative headline and the softer core MoM print. That rally is probably a fade. Core PCE at 3.29% YoY — 129 basis points above target — is not an environment where a Fed chair with something to prove on inflation credibility begins an easing cycle. Watch 2-year Treasury yields. The 2-year has been rangebound between roughly 4.20% and 4.55% in recent weeks. A significant rally on this print that pushes the 2-year toward the lower end of that range, or through it, is pricing in a policy path this data does not support.
Watch July PCE (released late August) for trend confirmation. June's +0.13% core MoM either marks the beginning of a genuine deceleration toward the 0.10%–0.15% monthly pace consistent with the 2% target, or it is a one-month soft print inside a still-elevated regime. If July core MoM reverts toward +0.25%–0.33%, June was noise. If July holds near +0.13%, the disinflationary channel is reopening in a meaningful way.
Energy's next move determines the headline narrative. Brent crude's trajectory over July will drive August's PCE headline directly and mechanically. If Iran-war risk premium re-expands and crude rebounds toward $115, headline PCE snaps back positive and any "disinflation is here" narrative built on June evaporates. Watch crude as a leading indicator for next month's headline PCE before the BEA data drops.
The spending-income gap keeps services inflation pressure alive. Rate-sensitive consumer sectors — credit card issuers, auto lenders, retailers with revolving credit exposure — remain in an environment where consumer demand has not broken. That is not the setup for imminent Fed relief. It is the setup for continued higher-for-longer that pressures borrowing-dependent business models.
The new Fed Chair's first communications are the wildcard. Warsh inherits a 3.29% core PCE economy with a still-spending consumer and no clear mechanism for rapid disinflation. Any signal that he views 3.3% core as acceptable would move markets significantly toward the dovish re-pricing; any signal that it requires sustained restrictiveness would move the other direction. June's PCE gives him no cover for an early pivot — but it also gives the doves a data point to quote. Watch the next Fed statement for how he frames the word "progress."
The headline is negative. The story is that core PCE remains 129 basis points above target, the descent is measured in 13-basis-point monthly increments, and the Fed has no reason to move. June gives the doves a number. It does not give the Fed a reason to cut.
Source: U.S. Bureau of Economic Analysis — Personal Income and Outlays, June 2026 (released July 30, 2026). PCE Price Index data via BEA interactive tables.
This article is published for educational and informational purposes only. Nothing contained herein constitutes investment advice or a recommendation to buy or sell any security. Please consult a qualified financial professional before making any investment decisions.
Trading involves substantial risk. All content is for educational purposes only and should not be considered financial advice or recommendations to buy or sell any asset. Read full terms of service.