My Trading Game Plan Revealed - 03/17/2026: Oil Echoes 2008 and Private Credit Risk - High-Probability Trades in Energy, Tech, Gold and Crypto

The financial markets are a complex ecosystem where surface-level narratives often mask the deeper, structural currents driving price action. In this morning's My Trading Game Plan show, Gareth Soloway, Chief Market Strategist at VerifiedInvesting.com, peeled back the curtain on the current market environment. From an eerie historical parallel in the energy sector to the hidden dangers lurking in private credit, today's analysis provided a masterclass in separating media hype from technical and macroeconomic reality.
As markets inch higher on the back of slight pullbacks in oil, savvy investors must look beyond the day-to-day chop. Today's article expands on the critical themes, technical setups, and psychological traps discussed in the broadcast, offering a comprehensive roadmap for navigating these treacherous market waters.
The Oil-Equity Inverse Relationship and the 2008 Parallel
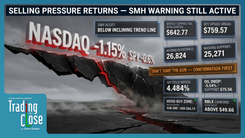
To understand the current action in the S&P 500, which managed a modest 1% bounce yesterday before stalling, one must look directly at the energy markets. There is a distinct, real-time inverse correlation playing out between the price of oil and broader equities. When oil drops on the 10-minute chart, S&P 500 futures simultaneously catch a bid.
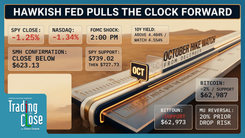
However, zooming out to the daily chart reveals a much more concerning picture. Since late February, oil has surged an astonishing 50%. This elevated pricing is not existing in a vacuum; it is actively bleeding into the broader economy. When the next CPI data prints, this energy surge will be factored in at an estimated average price of $85 per barrel. This creates a massive headwind for the Federal Reserve's inflation fight and, by extension, equity valuations.
But the most chilling aspect of oil's current trajectory is its historical precedent. As Gareth pointed out during the show, the current market dynamics are flashing warning signs:
"…eerily similar to 2008, just before the financial collapse, the financial crisis."
To fully grasp this comparison, we must look back at the market architecture of 2007 and 2008. During that period, oil went on an epic, parabolic run, skyrocketing from $50 per barrel to nearly $150 per barrel. While energy prices were going vertical, the underbelly of the stock market was rotting. The S&P 500 was quietly topping out and beginning its descent. The rising cost of energy acted as a massive tax on the consumer, accelerating the underlying credit issues that would eventually break the global financial system.
Private Credit: The New Subprime?
In 2008, the catalyst for the collapse was subprime mortgages and the toxic credit default swaps tied to them. Today, the fault lines are appearing in a different sector: the private credit markets.
We are currently witnessing private funds halting investor withdrawals—a classic hallmark of a liquidity crisis. This panic stems largely from the software and technology sectors. In the rush to capitalize on the artificial intelligence boom, countless startups and tech firms took out massive, high-interest loans to build out their AI infrastructure.
While established legacy tech giants like Oracle have highly profitable core businesses to service their debt, a vast swath of newer, unprofitable companies do not. The market is waking up to the reality that many of these AI-driven infrastructure loans may never be repaid.
Combine this institutional credit stress with a struggling U.S. consumer, and the macro picture becomes incredibly fragile. While the wealthy continue to spend, the middle and lower classes are buckling under the weight of inflation. Auto loans have reached all-time highs, and credit card defaults are steadily rising.
As Gareth noted regarding the timing of a potential reckoning:
"The question is, how much stimulus from the government or the Fed can push the can down the road, right?"
Timing a macro collapse is notoriously difficult, but the confluence of spiking oil, rising consumer defaults, and private credit illiquidity serves as a blaring siren for risk-aware investors.
Institutional Traps and the Psychology of Earnings
One of the most valuable lessons from today's broadcast centered on how institutional money manipulates retail psychology, particularly around earnings announcements and major technical breakouts.
Consider the recent price action in Nvidia. The semiconductor giant experienced a sharp pop on the back of a staggering $1 trillion revenue projection. Yet, almost as quickly as it spiked, the stock reversed, gave up its gains, and closed lower than before the announcement.
To the untrained eye, a $1 trillion revenue projection sounds like an undeniable catalyst for a massive rally. But markets are forward-looking mechanisms. That astronomical figure was already baked into analyst expectations; the company did not actually raise its forward guidance. The initial spike was nothing more than a short-term algorithmic reaction designed to trap emotional retail buyers before the smart money aggressively faded the move.
This same institutional game is played at key technical levels. Gareth highlighted Meta Platforms, which recently slipped below a critical support level at $609. However, he stressed the absolute necessity of waiting for a confirmed daily close below this level before initiating a short position.
"…the institutional money, they know every angle of human emotion…"
Institutions routinely push stocks just below support or just above resistance to trigger retail stop-loss orders and induce FOMO (Fear Of Missing Out). They force the weak hands to throw in the towel, scoop up the liquidity, and violently reverse the price. A similar setup is currently forming in Sandisk, which is approaching a double top resistance near $727. While the stock may pierce this level and push toward $730, traders must demand daily confirmation before treating it as a legitimate breakout. Assuming a breakout is real just because a level is temporarily breached is a surefire way to become exit liquidity for institutional algorithms.
High-Probability Setups: Nuclear Energy and Tech
Despite the macro headwinds, the market always provides localized opportunities for those who know how to read the charts. Today's analysis highlighted several compelling setups across different sectors.
The "Wedge Splosion" in OKLO
One of the most technically beautiful charts discussed was OKLO, a nuclear energy play. This stock suffered a catastrophic decline, tumbling from highs of nearly $200 down into the 50s. However, at these multi-month lows, the stock began forming a tight, down-sloping wedge pattern.
In technical analysis, when a beaten-down stock forms a tightening wedge at the absolute lows of its chart, it signifies that selling pressure has exhausted itself. The resulting breakout—what Gareth refers to as a "wedge splosion"—often yields violent upside momentum. OKLO is currently executing this exact breakout, providing a textbook example of how to buy quality, up-and-coming names at maximum consolidation rather than chasing them at all-time highs.
SMR and Uber Technicals
In the same nuclear genre, SMR (New Scale Power Corporation) has pulled back to major technical support. While perhaps not a viable long-term investment, the chart dictates a high-probability swing trade bounce, with a minimum upside target of $14 at the previous pivot low.
Conversely, Uber presents a different technical picture. Following news of a robo-taxi partnership with Nvidia, the stock gapped up. However, rather than chasing the gap, disciplined traders are watching the $80 to $81 zone. This area represents significant overhead resistance and could provide a lucrative, quick day-trade short opportunity if the price overextends into that supply zone.
For traders looking at Lemonade following its recent upgrade, the chart remains largely in no-man's land. The only viable, high-probability entry for a short position rests at distant pivot lows around $69, demonstrating the importance of patience and refusing to force trades in the middle of a range.
Crypto's Euphoria and the Inevitable Consolidation
The cryptocurrency market has been nothing short of historic in recent days, but the charts are signaling that a breather is imminent.
Bitcoin recently completed a staggering eight-day winning streak, surging from support at $65,000 all the way to $76,000—a massive $11,000 straight-line move. Ethereum mirrored this bullishness, posting its own eight consecutive up days.
While the broader technical structure remains highly bullish—with Bitcoin targeting the $80,000 to $85,000 zone and Ethereum looking toward $2,600 to $2,800—markets do not move in straight lines forever. After eight days of relentless buying, the charts are stretched. A period of consolidation, or even a retrace to the "scene of the crime" (the origin point of the breakout), is not only expected but necessary for the health of the longer-term uptrend. Traders who chase these assets after an $11,000 vertical move are letting FOMO override logic.
Precious Metals: The Necessity of the Emotional Flush
While crypto enjoys its moment in the sun, the precious metals sector is undergoing a painful, yet technically necessary, correction.
Gold is currently clinging to a major psychological and technical support level at $5,000. However, the chart has formed a classic inside bar wedge pattern—a bearish continuation flag following a recent drop. If Gold confirms a daily close below $5,000, the technical downside targets are stark: first a drop to the $4,865 pivot low, and eventually a deeper flush into the $4,400 to $4,300 range. Silver is exhibiting an even cleaner version of this exact same bear flag pattern.
To understand why this is happening, traders must understand the psychology of market cycles. Prior to this correction, the metals experienced a phase of pure, unadulterated euphoria. Price action overshot historical norms to the upside, driven by pure emotion.
Markets are like pendulums; an emotional overshoot to the upside demands an equal and opposite emotional overshoot to the downside to clear out the weak hands. The current price action has not yet emotionally wiped out the permabulls. Until that capitulation occurs, a true, lasting bottom cannot be formed.
However, this short-term bearish technical reality does not negate the long-term macroeconomic bull case for physical assets. As Gareth eloquently summarized:
"…until the governments of the world that have the fiat currencies, until they get their fiscal house in order and they stop spending like drunken sailors and just printing more money and running up debt, how do you not like physical assets, right?"
The debasement of fiat currency is a mathematical certainty given current global debt trajectories. But professional traders understand that they must trade the chart in front of them, not the macroeconomic eventuality that may take years to fully materialize. You can be a long-term fundamental bull while simultaneously shorting a near-term technical bear flag.
Conclusion: Logic Over Narrative
The overarching theme of today's market analysis is the absolute necessity of emotional control and technical discipline. Whether it is recognizing the 2008 parallels in the oil market, understanding the hidden risks in private credit, or refusing to be faked out by institutional algorithms on stocks like Meta and Sandisk, success requires a cold, calculated approach.
"Logic and charts beat hype and narratives every time."
As we navigate the coming days and weeks, the interplay between oil prices, the 10-year yield, and the S&P 500's downward parallel channel will dictate the broader market direction. By waiting for high-probability setups at extreme levels—like the wedge splosion in OKLO or the impending emotional flush in Gold—investors can strip the emotion out of their trading and operate with the mathematical edge of a casino.
The market will always provide opportunities for those patient enough to let the charts come to them. Stay disciplined, wait for daily confirmation on your levels, and never let the fear of missing out dictate your capital allocation.
Trading involves substantial risk. All content is for educational purposes only and should not be considered financial advice or recommendations to buy or sell any asset. Read full terms of service.