My Trading Game Plan Revealed - 05/14/2026: AI Frenzy, Inflation Shock and Tech Pullback Levels

The global financial markets are currently navigating a precarious intersection of geopolitical tension, staggering macroeconomic data, and historic technical extremes. As traders weigh the implications of high-stakes diplomatic meetings in China against parabolic runs in the technology sector, the need for objective, probability-based analysis has never been greater. In this morning's My Trading Game Plan show, Gareth Soloway, Chief Market Strategist at VerifiedInvesting.com, dissected these converging forces, providing a masterclass on how to navigate a market environment characterized by intense FOMO (Fear Of Missing Out) and underlying structural risks.
Today's analysis revealed critical levels across equities, commodities, and cryptocurrencies, offering a roadmap for traders looking to separate narrative hype from technical reality.
The Geopolitical Overhang: Waiting on a Deal
The trading day opened under the shadow of a highly anticipated meeting between President Trump and President Xi in China. Markets had aggressively priced in the expectation of a significant economic agreement, particularly in the semiconductor space, spurred by Nvidia CEO Jensen Huang's recent travel to the region. However, the initial silence from the summit has created a precarious setup for equities.
"And remember, this morning, East Coast time here in the US is actually their evening or nighttime. There were no major deal announcements," Gareth noted, highlighting the immediate risk to the market.
This absence of news creates what Gareth accurately described as an "air pocket" in the semiconductor sector. When markets price in perfection—or in this case, a massive international trade deal—the mere absence of confirmation can trigger sharp retracements. Stocks trading at or near all-time highs are particularly vulnerable to this dynamic. If the next 24 hours pass without a definitive announcement, the technical vulnerability of these extended charts will likely be exposed.
Adding to the geopolitical complexity is the firm rhetoric surrounding Taiwan. President Xi's stern warning for the US to stay out of Taiwan affairs serves as a stark reminder of the persistent tail risks in the region. Furthermore, hopes that China might exert pressure on Iran regarding the Strait of Hormuz—a narrative that caused oil to fade yesterday—appear to be dissolving. These geopolitical realities stand in sharp contrast to the market's current state of euphoria.
Inflation Reality vs. Market Euphoria
Perhaps the most glaring divergence in today's market is the disconnect between equity valuations and inflation data. The recent Producer Price Index (PPI) numbers were nothing short of historic, yet the broader market has largely chosen to ignore them in favor of the AI infrastructure narrative.
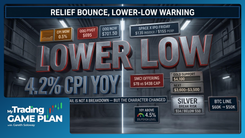
Gareth brought sharp focus to these alarming metrics: "1.4% inflation month over month, 6% inflation just in the last year. I mean, think about that… It's still shocking that they actually let these numbers be released, frankly, out there on the charts or out there in the data."
To put this into perspective, a 1.4% month-over-month inflation rate annualizes to nearly 15%. While retail sales came in line with estimates and jobless claims were only slightly higher, the underlying inflationary pressure remains a massive structural headwind. Historically, when inflation runs this hot, central banks are forced to maintain restrictive monetary policies that ultimately choke off equity multiples. Yet, the market's current hyper-focus on the AI trade is masking this macroeconomic deterioration.
Index Extremes: The S&P 500 and NASDAQ at the Brink
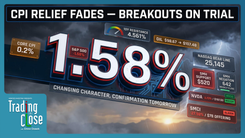
The technical posture of the major indices reflects a market driven by intense momentum rather than fundamental valuation. The S&P 500 has surged a staggering 18% in just six weeks, while the NASDAQ Composite has posted an even more mind-blowing 28% gain over the same period.
When analyzing charts with such vertical trajectories, traditional technical analysis requires a nuanced approach. As Gareth profoundly explained regarding market psychology and technical levels:
"Technical analysis works [for] everything in between the extremes. So when you have the insanity of ridiculous FOMO, we are going to blow through. When people are panicking and thinking the world's going to end, it's going to blow through to the downside resistance levels. Everything in between, that's where the technicals have more control."
Despite the FOMO, critical resistance levels are approaching. For the S&P 500, Gareth identified a crucial resistance zone between 7,450 and 7,500. This area aligns with high pivots from July, November, and December of 2024, as well as October of 2025.
The NASDAQ Composite is facing its own moment of truth. Currently trading around 26,400, the index is pressed directly against a major trendline connecting the highs of 2024 and 2025. If the geopolitical news disappoints and a pullback materializes, the former channel resistance will act as new technical support. Gareth identified the 25,000 level as the first major line in the sand for the NASDAQ—a roughly 1,400-point decline from current levels. While a 1,400-point drop sounds severe, in the context of a 28% six-week rally, it represents a standard, healthy technical retracement.
The 10-Year Yield: The Silent Alarm
While equity traders focus on tech stocks, bond market dynamics are quietly signaling potential trouble. The 10-year Treasury yield, a foundational metric for global asset pricing, is testing critical thresholds.
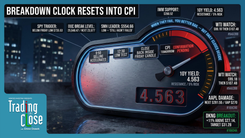
Gareth highlighted a fascinating technical event from yesterday's session: the 10-year yield pushed up, perfectly tagged the 4.5% level, and was immediately rejected. The precision of this rejection led Gareth to observe that it almost looked like institutional or central bank intervention to prevent a breakout.
Currently hovering around 4.45%, the 10-year yield remains dangerously close to that 4.5% breakpoint. In technical and macro analysis, 4.5% represents a psychological and mathematical barrier. If yields break decisively above this level, the cost of capital increases to a point where equity markets—even those fueled by AI exuberance—will struggle to ignore it.
Cisco, AI, and the Looming Employment Crisis
The intersection of technical analysis and macroeconomic forecasting was brilliantly illustrated through the analysis of Cisco Systems (CSCO). Cisco, famously the $600 billion market cap darling of the dot-com bubble, is surging once again on earnings, positioned as a key player in building AI data center infrastructure.
Currently trading around $117 (down slightly from a recent high of $122), Cisco's chart has gone completely vertical. By drawing a parallel channel from historical lows up to the dot-com highs, Gareth identified a potential resistance target of $145. While this target might seem aggressive, in a market where stocks like SanDisk recently tripled in weeks, a move to $145 is entirely within the realm of possibility.
However, the Cisco earnings report carried a dark undertone that speaks to a massive structural shift in the economy: the company announced 4,000 layoffs. This is not an isolated incident. As companies integrate AI to drive efficiency, human capital is being systematically reduced.
Gareth offered a sobering macroeconomic projection based on this trend: "I think we will see unemployment surging by 2027 into 2028 above 10%."
This projection ties directly into the broader economic picture. When you combine the aggressive replacement of workers via AI with the staggering levels of national debt and fiscal irresponsibility, the long-term foundation of the economy looks incredibly fragile. The current market rally is celebrating the corporate cost-savings of AI, but eventually, the economy must reckon with the reality of a diminished consumer base.
Tech Setups: CrowdStrike and Nvidia
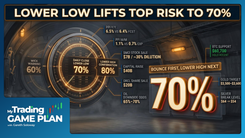
The technical setups across individual tech names are flashing warning signs for late buyers. CrowdStrike, which has surged 55% without any specific earnings catalyst, has pushed directly into a double top formation. Double tops are classic reversal patterns, representing an area where supply previously overwhelmed demand. Based on this technical structure, Gareth expects CrowdStrike to face rejection and pull back toward the $525 level.
Nvidia, the undisputed leader of the AI narrative, is also showing signs of exhaustion. Up six consecutive days heading into its earnings report next Wednesday, the chart is becoming distinctly toppy. Should the stock experience an earnings-driven pop, Gareth has identified a major trendline resistance at the $240 level. Traders holding through earnings must be aware of these overhead supply zones, as parabolic runs eventually revert to their mean.
Commodities: Copper's Breakout and Precious Metals
The commodity space is offering its own set of critical technical signals. Copper, often viewed as a barometer for global economic health (and a vital component in AI data centers), has pushed to new all-time highs, piercing a double top from January. Gareth mapped out a beautiful parallel channel connecting the lows of 2025, which projects a major resistance level at $7.
The precious metals complex is currently taking a breather. Gold has traded flat for the last six days, forming what Gareth identified as a potential micro bull flag. This sideways consolidation, rather than a sharp selloff, suggests underlying strength and opens the door for a potential test of the $4,900 to $5,000 level. However, traders must respect that gold remains in a recent short-term downtrend until it definitively breaks higher.
Silver, which broke through minor resistance at $82 earlier in the week, is currently pulling back. The next major upside target remains the $92 to $93 zone, marking the highest point before its previous major decline. Interestingly, Gareth noted an intermarket correlation to watch: if copper hits its resistance and begins to pull back, silver—which carries heavy industrial applications—will likely follow suit, despite the long-term bullish case for precious metals.
In the energy sector, oil remains flat to slightly lower. The technical roadmap is clear: a break of the short-term trendline around $103 opens the door for a rally to $110, and potentially $115. The $115 level represents a massive structural resistance where Gareth noted he would look to initiate short positions.
Bitcoin's Relative Weakness: A Warning Sign?
One of the most profound observations in today's analysis centered on Bitcoin's relative performance. Currently facing rejection off its upper range, Bitcoin is struggling to break through the $82,000 to $83,000 resistance zone. If it can clear this hurdle, the next target is $85,000 to $86,000.
However, the real story is Bitcoin's underperformance compared to the tech sector. Both the NASDAQ and Bitcoin are up roughly 30% from their recent lows. Historically, Bitcoin acts as a high-beta asset relative to tech; if the NASDAQ moves 30%, Bitcoin typically moves three times that amount.
"Usually, historically, if the NASDAQ goes up 30%, Bitcoin would go up 3X that. It hasn't happened. So, again, you know, that's a little concerning if you're a bull on Bitcoin," Gareth explained.
This divergence is occurring despite the looming Clarity Act vote, which crypto bulls hope will provide regulatory tailwinds. When an asset fails to perform as historically expected during a period of intense market liquidity and risk-on sentiment, it often signals underlying structural weakness or a shift in institutional capital flows.
Conclusion: Discipline in the Face of Extremes
Today's My Trading Game Plan highlights the stark contrast between market sentiment and technical/macro realities. We are witnessing a market where the S&P 500 and NASDAQ have gone vertical, ignoring 6% year-over-year inflation, rising 10-year yields, and the long-term economic threat of AI-driven job displacement.
For traders, the next 24 hours are critical. The presence or absence of a US-China deal will likely dictate whether the market's parabolic trend continues to blow through resistance, or if gravity finally takes hold, sending indices back to their structural support levels.
By mapping out precise levels—from the NASDAQ's 25,000 support to Cisco's $145 target, and CrowdStrike's $525 rejection zone—Gareth provides the framework necessary to trade without emotion. In a market driven by historic FOMO, adhering to logic, probabilities, and strict technical levels is the only sustainable path to long-term profitability.
Trading involves substantial risk. All content is for educational purposes only and should not be considered financial advice or recommendations to buy or sell any asset. Read full terms of service.