My Trading Game Plan Revealed - 06/30/2026: S&P 500 Failed Breakout Warning Semiconductors Yen Carry Trade Bitcoin Key Levels

Holiday Week Markets Are Testing Risk: Gareth Is Watching the Failed Breakout, Semis, Yen and Bitcoin
The headline this week is the shortened holiday schedule. Gareth Soloway’s read was more important than that: thin holiday volume is meeting several major technical decision points at the same time.
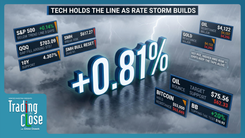
The market does not need heavy volume to send a message. It needs the right levels to fail. That is the framework Gareth laid out in this morning’s My Trading Game Plan show. The S&P 500 is testing whether its latest breakout can hold. Semiconductors are showing exhaustion after the AI run. USD/JPY is putting the yen carry trade back in focus. Bitcoin is pressing a key breakdown level.
That combination matters because these are not isolated charts. They are different expressions of the same question: is risk appetite still holding, or is the market starting to reject the breakout?
The Jobs Report Is a Catalyst, Not the Whole Story
With the U.S. stock market closed Friday for the July 4th holiday, the jobs report moves into Thursday morning. That creates a simple setup for traders: the data matters less than how the market reacts to it.
A strong jobs number can sound bullish on the surface, but markets may process it differently if it pushes rate-cut expectations farther out. A weaker number can raise economic concerns, but it can also increase the odds of easier policy later. That is why Gareth’s focus was not on guessing the report. It was on the technical levels that will show whether the market accepts or rejects the news.
The first level is in the S&P 500.
The S&P 500 Is Testing Failed-Breakout Risk
Gareth’s bigger-picture S&P 500 chart is built around a long-term parallel channel. Price has been pushing near the upper end of that structure, but the risk now is a failed breakout.
That matters because failed breakouts can create fast moves in the opposite direction. The market pulls in breakout buyers, then reverses back below the level that was supposed to hold. Once that happens, the buyers who chased strength become trapped supply.
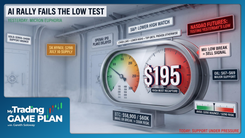
The level that matters now is roughly 7,250. A close back below that area would weaken the breakout attempt and put the prior highs near 7,000 back in play as the next major reference.
This is where confirmation matters. Holding above the level keeps the breakout alive. Losing it changes the structure.
Semiconductors Are the Sector Tell
The semiconductor group remains one of the clearest tells for risk appetite. If the AI trade is still leading, semis need to hold up. If they start to fail, the broader index becomes more vulnerable.
Gareth pointed to the weekly chart of the SOX semiconductor index and highlighted a reversal engulfing candle. His definition was clear: the candle opens above the prior week’s high and closes below the prior week’s low. That is a stronger warning than a standard topping tail because it shows buyers had early control and lost it completely by the close.
That same message is showing up in individual names. Nvidia has pulled back from its highs. Micron delivered strong earnings, gapped higher, then gave back the move. Gareth compared that type of action to Oracle’s prior gap-up reversal, where the headline looked bullish but the chart was already warning that buyers had overpaid.
The lesson is not that AI is finished. The lesson is that narrative does not override price. When a crowded leadership trade starts rejecting good news, the chart is telling traders to pay attention.
USD/JPY Is the Macro Chart Behind the Tech Trade
The other chart Gareth emphasized was USD/JPY. The dollar is pushing higher against the yen, which means yen weakness is back on the board.
That matters because the yen carry trade is tied directly into global risk appetite. Institutions have spent years borrowing yen at low rates and using that capital to buy higher-yielding assets, including U.S. equities and mega-cap tech. The trade works as long as the currency side stays stable.
The risk is not yen weakness by itself. The risk is instability. If the yen moves too far, or if the Bank of Japan intervenes and forces a sharp reversal, institutions may be forced to unwind the carry trade. That can create selling pressure in the same U.S. risk assets that benefited from the carry in the first place.
That is why USD/JPY belongs in the same conversation as semiconductors and the S&P 500. A currency move can become an equity-market problem if it forces positioning to unwind.
Bitcoin Is Pressing Its Own Line in the Sand
Bitcoin is also sitting at a major technical decision point.
Gareth’s key level is $58,800. Bitcoin has been heavy, and recent bounces have continued to take the shape of bear flags rather than true reversals. A daily close below $58,800, followed by confirmation, would open the door to $53,000 and then the psychological $50,000 area.
Until Bitcoin reclaims strength, the bias remains weak. The chart does not need a story. It needs confirmation.
Gold, Silver and Oil Are Sending Different Messages
Commodities are not moving as one group.
Gold flushed to roughly $3,900 overnight and bounced. That keeps $3,900 as the support level that matters. If it holds, Gareth is watching the upper trendline near $4,300. If $3,900 breaks, the next downside reference is around $3,500.
Silver is less constructive. Gareth’s read is that the chart is forming a bear flag, with $54 as the first downside support and $50 below that.
Oil is firmer in the near term. Gareth noted that crude is holding support and that Strategic Petroleum Reserve refill demand can create a floor beneath the market. The level he is watching is $67. As long as crude holds above that area, the downside is more contained.
Bottom Line
The shortened holiday week is not the main story. The main story is that several risk signals are lining up at the same time.
The S&P 500 needs to hold the failed-breakout level near 7,250. Semiconductors need to stop rejecting strength. USD/JPY needs to avoid a carry-trade shock. Bitcoin needs to hold $58,800.
That is the framework. If those levels hold, the market can keep working through the holiday-week noise. If they start failing together, the read changes from consolidation to risk-off confirmation.
This article is intended for informational and educational purposes only and does not constitute financial advice. All trading involves risk. Past performance is not indicative of future results.
Trading involves substantial risk. All content is for educational purposes only and should not be considered financial advice or recommendations to buy or sell any asset. Read full terms of service.