My Trading Game Plan Revealed - 10/22/2025: Market Warning Signals, Gold, Bitcoin and S&P Pullback Risk
In this morning's My Trading Game Plan show, Gareth Soloway, Chief Market Strategist at Verified Investing, delivered a sobering analysis of the current market landscape. While major indices tread water, significant corrections in other asset classes like gold, silver, and Bitcoin are flashing warning signs. With key earnings reports from Netflix and Texas Instruments disappointing investors, the market's vulnerability is becoming increasingly apparent.
Today, we'll expand on the critical themes from the show, exploring the technical patterns that suggest a potential "air pocket" drop, the historical parallels guiding the gold correction, and the disciplined strategies that separate professional traders from the crowd.
The Last Domino Standing
While the S&P 500 and Nasdaq have been characterized by choppy, sideways action, the underlying technicals paint a precarious picture. The S&P 500 is currently contending with a critical wedge pattern. After breaking to the downside roughly a week and a half ago, the index has been retesting the underside of the broken trendline. Yesterday’s price action was telling: the market pushed above the line intraday but failed to hold, closing back below it.
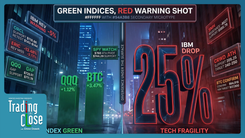
As Gareth noted, this price action suggests the market remains vulnerable. But the most compelling evidence comes from a broader, multi-asset perspective. "Bitcoin has fallen 15% off of its highs. Gold and silver have collapsed off of their highs. The only thing left right now is the stock market," he cautioned. This sequence is critical. When leading risk and safe-haven assets that were hitting all-time highs undergo sharp corrections, it often precedes a similar move in the broader equity market.
Gareth warns that the market may be setting up for "an air pocket type drop… where we'll see a 5 to 10% correction in very short order." This isn't just a hunch; it's supported by a bearish candlestick formation known as an "inside bar pattern." Following a large red down candle, the market has spent several days trading within the high-to-low range of that candle. In technical analysis, this is considered a bearish continuation pattern unless the high of the initial red candle is decisively broken. This pattern, combined with the broken wedge and weakness in other asset classes, creates a high-probability scenario for downside.
Gold: A 1979 Echo with a Modern Twist
The dramatic pullback in gold has been the headline story, but for followers of My Trading Game Plan, it was an anticipated move rooted in a fascinating historical parallel. The recent price action in gold has almost perfectly mirrored the setup from 1979, which also saw a powerful up-move, a consolidation, and then precisely nine consecutive up-weeks before a major correction.
However, while the technical pattern is a mirror image, the fundamental backdrop is vastly different. This is where historical context becomes crucial for navigating the future path.
- Interest Rates: In 1979-1980, Fed Chair Paul Volcker was aggressively hiking interest rates to combat inflation, with rates soaring to 18% and beyond. Today, the Federal Reserve is in a rate-cutting cycle.
- National Debt: Back then, the U.S. debt-to-GDP ratio was a manageable 32%. Today, it stands at a staggering 130%.
- De-Dollarization: The 1970s and 80s were a period of unquestioned dollar dominance. Today, a global de-dollarization trend is underway as countries diversify away from the U.S. dollar.
"All of these things mean that, sure, gold's going to pull back, but it will have opportunities for next legs to the upside and new all-time highs," Gareth explained. This context suggests that while a correction was technically due, a 60%+ collapse like the one seen in the early 1980s is highly improbable.
For traders, this means viewing the pullback as an opportunity. Gareth outlined his game plan with clear levels:
- Swing Trade Support: Key support levels to watch for potential bounces are at $3,948 and $3,845 USD.
- Long-Term Accumulation: Should the sell-off intensify, the area around $3,500 USD represents a "longer term investing accumulation zone" where he would begin buying for a significant hold.
Cracks in the AI Armor
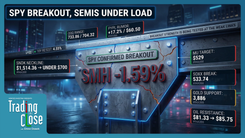
The semiconductor sector has been the undisputed leader of the market rally, but recent earnings are revealing the first cracks in its seemingly impenetrable armor. Texas Instruments (TXN) plunged nearly 10% after its report, a move Gareth described as the "first kind of break in the glass or crack in the glass of the semi AI trade."
While Texas Instruments isn't a high-flyer like NVIDIA, its significant post-earnings drop is a warning shot for a sector priced for perfection. This weakness is amplified when looking at the chart of the semiconductor index itself. A long-term trendline drawn from the COVID lows in 2020 has acted as a perfect resistance level. The index was rejected from this line during the 2022 bear market, and it recently tagged it again. The last major touch of this line led to a significant correction, and the charts suggest another one may be due.
Adding to the tech sector's woes, Netflix (NFLX) is also getting hammered. The stock is falling on concerns of slowing growth and margin compression in a saturated streaming market. With a forward P/E ratio of 40, Netflix carries a premium valuation that demands exceptional growth—growth that appears to be waning. For potential trades, Gareth is watching a day-tradable level around $1,106 USD and a possible swing trade setup at $1,060 USD.
The Power of Simplicity in Trading
In a world of complex indicators and algorithms, Gareth’s analysis consistently demonstrates that the most effective technical analysis is often the simplest. His calls on the tops in silver and the gold miners (GDX) were not based on convoluted formulas, but on clean, simple parallel channels drawn from major historical pivot points.
For silver, connecting the 2008 financial crisis low to the 2020 COVID low and dragging a parallel line to the highs perfectly identified the recent peak. "Simplicity is the spice of life, in my personal opinion," Gareth stated. "If it's too complex, I ain't doing it… I'm not doing calculus here. I promise you that."
This approach is empowering because it’s accessible. It proves that any dedicated student of the charts can identify high-probability turning points without needing a Ph.D. in mathematics. The gold miners (GDX) chart tells a similar story. A simple trendline connecting the COVID low to a subsequent major high precisely pinpointed the recent top, leading to the current sharp correction. Now, Gareth is using Fibonacci retracements to identify potential buy zones, eyeing the 38.2% level around $65.50 USD to begin "nibbling" on a long position.
Bitcoin and the Failed Rotation
As gold began its sharp descent, a narrative quickly emerged on social media: money would rotate out of gold and back into Bitcoin. For a moment, it seemed to be playing out as Bitcoin popped higher intraday. However, the move quickly faded, and the cryptocurrency gave back all its gains.
This failure is more significant than it appears. "If there was a rotation game, why did Bitcoin give back?" Gareth asked. The inability to hold those gains suggests that while retail investors may have been rotating capital, a larger entity—likely institutional money—was selling into that strength. "It tells us someone bigger was dumping into that… they were overpowering the retail rotation of capital. And that my friends… is a warning sign."
This price action weakens the thesis that Bitcoin’s recent decline was merely due to a temporary capital rotation into gold. The chart now presents a clear test. If Bitcoin cannot reclaim the trendline around $111,000 USD, the next major target to the downside is the parallel channel support between $95,000 and $96,000 USD.
Trading Discipline: The Art of Not Chasing
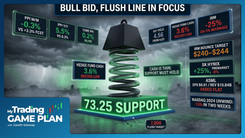
One of the most valuable lessons from today's session came from the natural gas chart. The commodity recently staged a powerful breakout, surging from $3.36 to over $4.00 USD. For many amateur traders, the impulse would be to chase this move, driven by fear of missing out (FOMO).
Gareth’s approach is the polar opposite. "Do I buy breakouts? Heck no… I don't chase them," he declared. Chasing a 20-30% rally is a low-probability, high-risk endeavor. The professional approach is one of patience and planning. "What I do know is I say I either miss the trade, which is fine. Cause there's a million trades or I wait for a retrace to the scene of the crime and I buy for the next leg up."
This "retrace to the scene of the crime" strategy—waiting for price to pull back to the initial breakout point—offers a much better risk-reward entry. It requires discipline to watch a move happen without you, but it's this very discipline that preserves capital and defines a sustainable trading career.
Conclusion: Navigating the Warning Signs
The market is sending a cascade of warning signals. The corrections in gold, silver, and Bitcoin are not isolated events; they are likely canaries in the coal mine for the broader stock market, which remains the last major asset class to hold near its highs. Technical patterns on the major indices are bearish, and earnings season is beginning to expose weakness in the market's most important sectors.
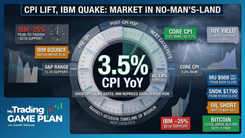
As we head into major earnings from Tesla and IBM, the message from the charts is one of caution and preparation. By understanding the multi-asset landscape, respecting key technical levels, and employing the discipline to plan trades rather than chase them, traders can position themselves to navigate the potential volatility ahead with clarity and confidence.
Trading involves substantial risk. All content is for educational purposes only and should not be considered financial advice or recommendations to buy or sell any asset. Read full terms of service.