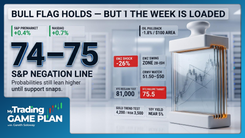
My Trading Game Plan Revealed - 10/28/2026: FOMC Volatility, S&P 500 Toward 8000, Oil Breakout and Bitcoin at 81K

Fed Decision, S&P 500 Targets and Bitcoin: Gareth Soloway's October 28 Trading Game Plan
October 28, 2026 | Game Plan Revealed | Verified Investing
The Federal Reserve's interest rate decision arrives today with the S&P 500 maintaining its bullish structure, Treasury yields showing signs of weakness, and several major technology companies preparing to report earnings. For traders, the combination creates an environment where technical confirmation becomes especially important. A market can have a bullish setup heading into a major announcement, but the reaction to that announcement determines whether the setup continues to hold.
During Wednesday's My Trading Game Plan, Gareth Soloway, Chief Market Strategist at VerifiedInvesting.com, examined the technical levels shaping the next potential moves across stocks, bonds, commodities, and Bitcoin. His framework focused on identifying where price has room to move, where resistance could interrupt that move, and which levels would signal a change in market direction.
Federal Reserve Rate Decision: What Traders Are Watching on October 28
The Federal Reserve is scheduled to announce its interest rate decision at 2:00 p.m. ET, followed by Fed Chair Kevin Warsh's press conference at 2:30 p.m. According to the futures pricing cited during the morning show, markets were assigning a 90.6% probability to rates remaining unchanged. That makes a hold the widely expected outcome, although surprises remain possible.
Gareth's analysis focused on how the Fed's communication could influence expectations for the December meeting. With inflation still a concern, Warsh's comments on future monetary policy could affect Treasury yields, equities, and other risk-sensitive assets. A more hawkish message could pressure stocks through higher yields, while a less restrictive outlook could provide support if traders interpret it as consistent with improving inflation conditions.
The technical response following the announcement will help establish whether buyers remain in control. Initial moves around Fed announcements can reverse as markets process the statement and press conference, making sustained price action around established support and resistance levels particularly useful for evaluating the next swing setup.
10-Year Treasury Yield Chart: Bear Flag Signals Potential Downside
One of the more important charts Gareth highlighted was the 10-year Treasury yield. Following a recent decline, yields have entered a sideways-to-upward consolidation that resembles a potential bear flag. Gareth also identified the possibility of an emerging head and shoulders structure, although that formation would require additional development and confirmation.
A bear flag generally forms when a sharp decline is followed by a smaller consolidation against the prevailing direction. If yields break below the lower boundary of that consolidation, the pattern would favor another move lower. A sustained breakout above the structure, however, would weaken the bearish interpretation and require traders to reassess the setup.
The implications extend beyond the bond market. Lower Treasury yields can ease pressure on equity valuations, particularly in growth-oriented sectors where expectations for future earnings play a significant role in pricing. That relationship helps explain why the yield chart deserves attention alongside the S&P 500 as the Fed prepares to deliver its decision.
S&P 500 Technical Analysis: Bullish Structure Keeps 8,000 in Focus
The S&P 500 continues to show a constructive technical structure following its recent bounce from a major support area. Gareth highlighted the strength of that recovery during Wednesday's session, with the broader bullish framework remaining intact as the market approaches another round of potential catalysts.
The larger technical objective remains the psychological 8,000 level. Before that comes into play, the market faces intermediate resistance, including an overhead gap-fill area and a higher pivot resistance level identified during the show. These areas provide reference points for evaluating whether the rally is extending or beginning to encounter meaningful selling pressure.
Gap fills can attract attention because they represent areas where price previously moved quickly without trading through every intervening level. When the market returns to those zones, traders can evaluate whether buyers have enough momentum to push through or whether sellers begin defending the area. The reaction is especially relevant with the Fed decision and major technology earnings capable of changing short-term sentiment.
For now, the bullish interpretation remains supported by the recovery from Friday's support area. A sustained move through overhead resistance would strengthen the case for additional upside, while a reversal that breaks the recent support structure would weaken the setup. The 8,000 objective remains a potential destination rather than a guaranteed outcome.
Crude Oil Price Outlook: Wedge Pattern Nears a Breakout Decision
Crude oil is another market where Gareth sees an important technical formation developing. Prices were higher during the morning session amid renewed geopolitical tensions involving Saudi Arabia, adding another layer of uncertainty ahead of the Fed announcement.
On the chart, oil has been consolidating within a large wedge pattern, with converging trend lines gradually compressing price action. As the range narrows, the market approaches a point where a directional break becomes increasingly likely. The pattern itself does not establish which direction will ultimately prevail.
Gareth explained how tightening price action can create the conditions for a stronger move once one side of the range gives way. An upside breakout would suggest buyers have gained control of the consolidation, while a downside break would indicate sellers are taking over. For swing traders, the next important signal will be whether price can sustain a move beyond the wedge boundary.
Oil also carries broader macroeconomic implications. Higher energy prices can add pressure to inflation expectations and complicate the Fed's policy outlook. That makes the wedge worth monitoring as both an individual technical setup and a potential influence on the Treasury yield and equity market reaction.
Technology Stock Earnings: SK Hynix Strength and Key U.S. Setups
Earnings season is producing significant price moves across the technology sector. South Korean semiconductor manufacturer SK Hynix reported strong results, with its shares surging during the Asian session and helping lift the broader KOSPI index. The response reflects continued interest in semiconductor and artificial intelligence-related companies, although individual charts remain important when assessing whether a move has become extended.
Gareth also reviewed several U.S. technology stocks presenting different technical conditions. Oracle, Alphabet, Vertiv, and Seagate illustrate how earnings-related volatility can create opportunities to evaluate established support and resistance areas. The setups vary considerably, from potential continuation patterns to stocks approaching historical levels after sharp moves.
Oracle (ORCL): Descending Trendline Breakout Opens a Swing Trade Setup
Oracle is showing a potential bullish development after moving above a descending trendline on its daily chart. That breakout suggests the stock may be transitioning away from its recent downward structure, provided price can maintain the move.
Gareth identified the prior high near \$168 as a potential upside reference point. The more important confirmation is whether Oracle can continue holding above the broken trendline on a daily closing basis. A move back below the line would weaken the breakout and raise the possibility of a failed technical signal.
Alphabet (GOOGL): Earnings Could Bring the \$305 Gap Into Focus
Alphabet is scheduled to report earnings after Wednesday's market close, alongside Microsoft. Gareth identified a potential support opportunity on Alphabet's chart if the earnings reaction pushes the stock lower.
A gap-fill area just below \$305 stands out as a possible technical destination in that scenario. If price declines toward the gap, the reaction around that level could help determine whether buyers are beginning to regain control. A sharp decline through the area without stabilization would suggest the stock needs more time to establish support.
Microsoft presents a different technical picture, with its stock trading closer to recent highs ahead of earnings. Gareth's analysis suggested that Alphabet offered a more clearly defined downside reference area, although the earnings reaction will determine whether that potential setup develops.
Enphase (ENPH): Historical Support Near \$22.50 After a Sharp Decline
Enphase has experienced a substantial selloff, leaving the stock near multi-year lows. Gareth pointed to the COVID-era low around \$22.50 as an important historical support reference on the weekly chart.
The level could attract buying interest if price approaches it, but the broader downtrend remains a significant consideration. A brief reaction from historical support would not necessarily establish a durable bottom, particularly following a decline of this magnitude. Gareth also emphasized the importance of examining the company's financial condition before considering a longer-term bullish thesis.
The distinction between a short-term technical reaction and a confirmed swing reversal is particularly important in heavily damaged stocks. A stronger setup would require evidence that selling pressure is easing and that price can begin building support above the historical level.
Vertiv (VRT), Seagate (STX) and GE Vernova (GEV): Earnings Volatility Creates Technical Watchpoints
Vertiv demonstrated the strength of earnings-related momentum, with the original show recap describing a sharp move from approximately \$210 to \$245. Following a move of that size, previous pivot highs and gap-fill areas can become useful resistance references, particularly if momentum begins to slow.
Seagate also experienced a volatile earnings reaction, initially moving lower before recovering. Gareth identified a lower unfilled gap as a potential future reference if the stock eventually weakens. For GE Vernova, he discussed a deeper support area around \$720, with additional levels near \$680 and \$670.
These setups illustrate why the size of an earnings move needs to be evaluated alongside the chart structure. A stock can appear extended and continue higher, while an apparent support level can fail when selling pressure remains strong. Confirmation around the relevant price area provides a stronger basis for evaluating the next potential swing.
Gold and Silver Technical Analysis: Recovery Patterns and Downside Risk
Gold is attempting to stabilize after finding support near a recent pivot level. Gareth discussed two possible formations developing on the chart: a V-shaped recovery that could eventually support another upside breakout, or a bearish consolidation that would favor renewed weakness.
The next meaningful price movement should help clarify which structure is developing. A sustained recovery through nearby resistance would strengthen the bullish interpretation, while a breakdown from consolidation would suggest sellers remain in control. Until the pattern develops further, the chart offers competing possibilities without a confirmed directional signal.
Silver provided a more defined technical reference following a bottoming tail in the previous session. That candle formed when price moved sharply lower before recovering, suggesting buyers stepped in during the decline. The low of the tail now serves as an important reference for evaluating whether that buying interest remains intact.
A daily close below the bottoming tail would weaken the potential bullish reversal and leave silver exposed to additional downside, with Gareth identifying \$50 or lower as a possible destination. Holding the tail low would preserve the possibility of a recovery, although additional strength would still be needed to confirm a sustainable bullish move.
Bitcoin Price Analysis: \$81,000 Remains the Critical Resistance Level
Bitcoin is approaching another important technical decision after breaking below the \$81,000 area. Gareth highlighted an attempted recovery above that level during the morning session, followed by renewed weakness as price struggled to sustain the move.
The \$81,000 area has become the primary reference for the near-term technical outlook. Following the breakdown, former support is now acting as potential resistance. A daily close back above \$81,000 would improve the bullish case and suggest buyers are beginning to reclaim the lost level.
As long as Bitcoin remains below that area, the bearish technical structure stays in place. Gareth identified approximately \$75,500 as a potential downside objective if selling pressure continues. That target represents a chart-based possibility, with the strength of any subsequent decline depending on how price behaves around intervening support areas.
Bitcoin's reaction also provides a useful read on broader risk appetite. With the Fed decision approaching and Treasury yields potentially influencing liquidity expectations, the cryptocurrency's ability to reclaim resistance could offer additional context on whether speculative assets are regaining strength.
Gareth Soloway on Trading Psychology: Why Discipline Supports Technical Analysis
Beyond the individual charts, Gareth returned to one of his core trading principles: effective technical analysis depends on applying a repeatable process and managing emotional decisions.
Trendlines, gap fills, Fibonacci retracements, and historical pivot levels provide ways to identify potential turning points. None guarantees a particular outcome. Their value comes from giving traders a consistent framework for evaluating price behavior, defining risk, and recognizing when the original thesis has changed.
Gareth also discussed how fear and greed can interfere with otherwise reasonable trading decisions. A trader may recognize a major support level but hesitate when price approaches it because the surrounding news is negative. The opposite can happen near resistance, where the excitement of a strong rally makes it difficult to recognize increasing downside risk.
That same discipline applies to managing profitable positions. Gareth highlighted the danger of allowing tax considerations to override an established trading plan, particularly when holding a winning position longer exposes it to a substantial reversal. Tax consequences remain important and depend on individual circumstances, but they should be considered alongside the investment thesis, time horizon, and risk-management plan.
The broader lesson is that consistency comes from understanding the setup, identifying the conditions that support it, and recognizing when those conditions no longer exist. Technical analysis provides the framework. Execution and risk management determine how that framework is applied.
Market Outlook: Key Technical Levels to Watch After the Fed Decision
Wednesday's market setup brings several important technical developments together. The S&P 500 remains constructive as it works toward higher resistance levels, the 10-year Treasury yield is consolidating within a potentially bearish pattern, and crude oil is approaching a wedge breakout. Meanwhile, earnings are creating significant moves across technology stocks, and Bitcoin continues to struggle with resistance near \$81,000.
Gareth's framework provides a clear way to evaluate what comes next. The Fed announcement and upcoming earnings reports may create the initial volatility, but sustained moves through established technical levels will provide stronger evidence of whether existing trends are continuing or beginning to reverse.
For equity traders, the S&P 500's ability to hold its recent support structure will remain important as the 8,000 objective stays in view. In bonds, a breakdown in the 10-year yield could support the broader equity outlook, while an unexpected rise in yields may introduce additional pressure. Bitcoin's \$81,000 resistance and silver's bottoming-tail low offer similarly defined reference points in other markets.
The central takeaway from today's My Trading Game Plan is straightforward: establish the technical framework before the catalyst, evaluate the market's response, and allow confirmation to guide the next assessment. That approach keeps the focus on price structure and probability, even when headlines and volatility accelerate.
Watch Gareth Soloway's My Trading Game Plan on the Verified Investing YouTube channel for his daily technical analysis and market outlook. If the show has helped you develop your understanding of the markets, you can also leave a review using the link or QR code provided in the video's description.
Disclaimer: This content is provided for educational and informational purposes only and does not constitute financial, investment, tax, or trading advice. Technical analysis involves uncertainty, and no chart pattern or price level guarantees a particular outcome. Trading and investing involve risk, including the possible loss of principal. Always conduct your own research and consider your individual circumstances before making financial decisions.
Trading involves substantial risk. All content is for educational purposes only and should not be considered financial advice or recommendations to buy or sell any asset. Read full terms of service.