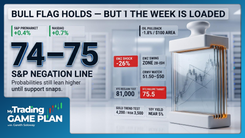
Trading The Close Market Recap - 10/26/2026: FOMC & Mega‑Cap Earnings Spark Volatility — Oil $148 Risk, Critical Tech Levels

S&P 500 Tests Key Support as Fed Decision and Earnings Put Traders on Alert
The market is heading into a week where technical levels may matter more than the headlines themselves. With the Federal Reserve's next policy decision and major corporate earnings approaching, traders face an environment where a single announcement could push prices through support or resistance. The question is whether those moves can hold once the initial reaction fades.
During Monday's Trading the Close, Verified Investing Pro Trader Drew Dosek focused on that difference. Several major indexes and individual stocks are approaching important chart levels, but many have yet to confirm their next direction. Rather than anticipating a breakout or buying every decline, Drew's approach centers on identifying where the technical picture changes and waiting for price to provide confirmation.
The S&P 500 and NASDAQ offer the clearest examples of this uncertainty. Meanwhile, crude oil is developing a potentially significant bullish pattern, and several technology stocks are approaching levels that could determine their next moves.
The common thread is straightforward: a technical level identifies an opportunity, but the reaction at that level determines whether the setup is worth pursuing.
S&P 500 Technical Analysis: Why 760.40 Support Matters This Week
The S&P 500 ETF is trading between two important technical boundaries, creating a relatively narrow range ahead of the week's major catalysts.
On the upside, Drew identified resistance near 767.13, where an inclining trendline has already rejected price. Consecutive daily closes beneath that boundary suggest buyers have not yet regained control of the near-term structure. A daily close above 767.13 would begin to challenge that bearish interpretation and could open the door to renewed upside momentum.
The more immediate concern is support at 760.40. Price has tested this horizontal level repeatedly, making it an important reference point for traders watching whether buyers can continue defending the area.
Repeated support tests deserve attention, but they do not guarantee a breakdown. Each test provides information about demand. If buyers continue stepping in and price begins reclaiming nearby resistance, the level may remain intact. If support breaks and price cannot recover it, the technical picture becomes more vulnerable.
This is especially relevant during earnings season, when corporate spending plans, margins, and forward guidance can influence broader market expectations. The focus on artificial intelligence infrastructure and capital expenditures adds another layer of uncertainty, particularly for technology-heavy indexes.
For Drew, the important distinction is between a market approaching support and one that has confirmed a breakdown. Until price resolves the range, traders have defined boundaries but limited directional confirmation.
NASDAQ Outlook: The 25,989 Support Level and 26,558 Resistance
The NASDAQ is presenting a similar technical challenge, although its longer-term chart adds important context.
Drew highlighted an inclining parallel channel dating back to 2016. The index traded within this structure for years before breaking above it in May 2026. That history makes the current price action particularly relevant because former channel boundaries can become important reference points when momentum begins to weaken.
The immediate level to monitor is 25,989, effectively placing the 26,000 area at the center of the near-term setup.
Sustained trading below this threshold would suggest the index is struggling to maintain its recent structure and could shift the technical outlook toward neutral or bearish. However, a move beneath support without follow-through would be less convincing than a confirmed breakdown.
On the upside, declining trendline resistance near 26,558 remains the more significant hurdle. A sustained move above that level would improve the bullish technical picture.
The distance between these boundaries leaves room for price to move in either direction without necessarily confirming a larger trend change.
That is why closing prices matter. During a week dominated by earnings and Fed expectations, an intraday move through resistance can look convincing before reversing. Waiting for confirmation may mean missing the first part of a move, but it can also reduce exposure to failed breakouts.
Crude Oil Price Outlook: Inverse Head and Shoulders Targets $116 and $148
While equity indexes are struggling with nearby resistance, crude oil is developing a different technical structure.
Drew identified an inverse head and shoulders formation, a pattern that can signal a bullish reversal when price breaks above its neckline and sustains that move.
The initial formation carries a measured-move objective near $116 per barrel. A larger version of the pattern presents an additional scenario, with $104 serving as the important breakout threshold.
If crude oil secures a daily close above $104 and confirms the larger formation, the measured move points toward approximately $148 per barrel.
That figure is a technical projection, not a forecast that oil must reach the target. Measured moves provide a framework for potential price expansion after a breakout, but the pattern can fail or fall short.
The broader implications are worth monitoring. A sustained rise in energy prices can increase transportation and production costs, potentially complicating the inflation outlook at a time when markets are focused on Federal Reserve policy.
This creates an important relationship between the oil chart and the broader market. Investors may be focused on the next interest-rate decision, but a significant energy breakout could influence inflation expectations well beyond this week's announcement.
The 10-year Treasury yield is also consolidating, adding another variable to the macro picture. Rather than assuming that sideways yields signal a specific economic outcome, traders should watch how bond yields respond to the Fed and incoming corporate guidance.
For now, $104 is the key oil level. The larger bullish scenario becomes more relevant only if price confirms the breakout.
Gold and Silver Technical Analysis: Finding Support After the Selloff
Gold and silver are offering a different lesson in market structure: the importance of separating a lower price from a confirmed buying opportunity.
Gold remains under pressure, with $4,100 serving as an important level for bulls to reclaim. Until price moves back above that area, the near-term technical picture remains vulnerable to further downside.
Drew identified a deeper potential support zone between $3,600 and $3,500, where historical trendlines could attract buying interest. That area provides a reference point for traders considering a medium- to longer-term recovery, although support must still be confirmed through price action.
The distinction is important. A stock or commodity can become substantially cheaper without immediately becoming technically attractive. The better question is whether price has reached a meaningful support area and whether buyers are beginning to defend it.
Silver Price Support: Why Drew Is Watching $53.26 to $50
Silver provides an especially useful example of how market psychology changes during a sharp decline.
After the strong advance described in Drew's analysis earlier this year, silver has pulled back significantly. Its head and shoulders formation reached a downside objective near $53.26, bringing price toward an area that now deserves attention as potential support.
Drew's preferred zone extends from approximately $53.26 toward $50, including a possible test of the nearby trendline.
His approach reflects a central principle of disciplined trading: strong rallies often attract the most enthusiasm when prices are extended, while meaningful pullbacks can create opportunities that investors were unwilling to consider at higher prices.
That does not mean silver must bounce at $50. It means the area offers a technical reference point where traders can assess the reaction, evaluate risk, and determine whether a recovery setup is developing.
The advantage comes from having the level identified before price arrives, rather than allowing fear or excitement to dictate the decision.
Bitcoin Price Analysis: $79,732 Is the Support Level to Watch
Bitcoin is also approaching an important technical decision.
Drew highlighted a trendline originating from a November 2025 pivot low. The line previously acted as resistance and is now being tested as potential support, a common technical development when price revisits an earlier breakout area.
The immediate level is $79,732, identified from the October 25 candle close.
A confirmed daily close beneath that threshold would weaken the current support structure and bring the $75,000 region into focus as the next significant downside reference.
Conversely, holding the trendline and reclaiming nearby resistance would support the argument that buyers are still defending the broader structure.
The important point is not that Bitcoin is guaranteed to decline if support breaks. It is that the technical framework changes when a previously defended level no longer holds.
For traders managing cryptocurrency exposure during a volatile macro week, that distinction can be more useful than reacting to each intraday price swing.
Tesla Stock: A Breakout Above $392 Could Change the Technical Picture
Tesla is approaching a potentially important breakout level following months of declining trendline resistance.
The stock has been trading beneath a trendline dating back to December 2025, and Monday's price action left it near that boundary without delivering a confirmed breakout.
Drew identified $392 as the level to watch.
A daily close above $392, followed by continued strength, would suggest buyers are beginning to overcome the declining resistance structure. Under that scenario, the chart could begin opening toward higher resistance, including the previous double-top region near $500.
However, the distance between $392 and $500 should not be interpreted as an unobstructed move. Intermediate resistance, broader market conditions, and the stock's reaction after the breakout would still matter.
A failed move above $392 would present a different message, suggesting the declining trendline remains influential.
This is where patience becomes part of the setup. Rather than buying simply because Tesla is approaching resistance, Drew's framework favors waiting for price to demonstrate that the resistance has been overcome.
Meta Stock Analysis: Fibonacci Support Near $629.92 and $593.40
Meta Platforms presents the opposite technical situation, with price moving toward potential support rather than pressing against a breakout level.
The original market discussion included concerns about substantial financing requirements and their possible implications for shareholders. The more useful trading question is how Meta responds as it approaches established technical support.
Drew identified the 61.8% Fibonacci retracement near $629.92 as the first significant area to monitor.
Below that level, the $600 psychological area and the gap-fill region near $593.40 form a broader support zone. If selling continues, a longer-term parallel channel dating back to April 2025 offers another potential reference near $551.33.
These levels create a framework for evaluating different outcomes rather than assuming the first support test must produce a bounce.
A constructive reaction near $629.92 could suggest buyers are beginning to defend the retracement. A decisive break would shift attention toward the lower support region, while continued weakness could eventually bring the longer-term channel into play.
Drew summarized the approach during the show:
"Just sit back, let the levels come to you, and then make the trade."
That is the practical advantage of mapping support before a stock reaches it. Traders can assess the setup against predetermined levels instead of making decisions based solely on the speed of the decline.
Boeing, Robinhood and Seagate: Earnings Setups to Monitor
Beyond the major indexes and large-cap technology names, Drew identified several individual stocks where the chart structure may become particularly important around earnings.
Boeing Stock: Lower Weekly Wicks Signal Buyers Defending Support
Boeing has broken a near-term rising trendline and entered a period of consolidation, but its weekly candlesticks show an interesting development.
The past four weekly candles have displayed substantial lower wicks, indicating that sellers pushed price lower before buyers recovered some of those losses.
Repeated lower wicks can suggest demand is developing in a particular area, even when the broader chart remains weak. However, they do not establish who is buying or guarantee that the next move will be higher.
If Boeing responds positively to earnings, Drew identified resistance near $204.08, corresponding to a previous July pivot.
A weaker earnings reaction would require traders to reassess whether the recent support behavior is sufficient to prevent further downside.
Robinhood Stock: Can HOOD Recover Toward $102?
Robinhood has experienced a substantial decline from its September high near $126, with the chart showing repeated breakdowns from bearish consolidation patterns.
Drew identified support near $84.75 and a potential rebound objective around $102.
After an extended decline, a relief rally is possible as selling pressure eases or traders cover bearish positions. However, a sharp selloff does not make a bounce inevitable.
For Robinhood, the first question is whether support can hold. The second is whether buyers can reclaim broken resistance levels that may now act as overhead supply.
The \$102 region becomes more relevant if price begins demonstrating that a recovery is underway.
Seagate Stock: Fibonacci Retracement and Bear Flag Breakdown
Seagate Technology has also pulled back sharply after its earlier advance, breaking below a bear flag and the lower boundary of an inclining parallel channel.
The stock is testing its 61.8% Fibonacci retracement, with the 78.6% retracement representing a deeper potential support area if weakness continues.
Earnings could become an important catalyst because the stock has already experienced a meaningful decline. A positive reaction might encourage a rebound toward the broken trendlines, while disappointing guidance could keep pressure on the existing structure.
The chart offers two competing possibilities. Buyers may defend the retracement and establish a recovery, or the breakdown may continue toward deeper support.
The earnings reaction and subsequent price action will help determine which scenario deserves greater weight.
Trading the Fed Decision and Earnings: What Matters Next
The coming sessions will test several technical structures at the same time, but not every price move will carry the same significance.
For the broader equity market, the first priority is whether the S&P 500 can defend 760.40 and whether the NASDAQ can maintain the 25,989 region. Those levels provide a near-term read on market stability.
On the upside, a sustained move above S&P 500 resistance near 767.13 or NASDAQ resistance near 26,558 would begin improving the technical picture.
Crude oil deserves separate attention because a confirmed breakout above $104 would introduce a potentially important inflation-related risk to the broader market outlook.
Among individual stocks, Tesla's $392 breakout threshold and Meta's support levels near $629.92 and $593.40 provide examples of how traders can approach opposite sides of a technical setup.
The challenge during a catalyst-heavy week is that price can move quickly through these areas before establishing a clear direction. Earnings announcements and Fed commentary may produce sharp initial reactions that reverse once traders reassess the information.
That makes follow-through especially important. A level being touched is not the same as a level being confirmed.
Bottom Line: Let Price Confirm the Setup
Monday's Trading the Close reinforced a lesson that becomes particularly valuable during volatile markets: knowing where a stock or index might react is only the beginning of
Trading involves substantial risk. All content is for educational purposes only and should not be considered financial advice or recommendations to buy or sell any asset. Read full terms of service.