Trading The Close Market Recap - 10/22/2026: Tech Bloodbath, Yield Plunge and SMH/Metals Sell-Off

Stock Market Sell-Off: Nasdaq Breaks Down as Traders Watch Critical Support Levels
Trading the Close Market Review | October 22, 2026
The technology sell-off on Thursday exposed a problem that extends beyond one difficult trading session. The S&P 500 lost an important rising trendline, the Nasdaq slipped back toward a long-term technical channel, and semiconductor stocks began testing levels that could determine whether buyers are ready to defend the market's recent leaders.
The late-session bounce offered some relief, but it did not repair the technical damage. That was the central message from Verified Investing Pro Trader Drew Dosek during Thursday's Trading the Close. The immediate question is no longer whether stocks are oversold. It is whether the market can establish support before another round of selling develops.
There is an important difference between a market that is pulling back within an established uptrend and one that is beginning to lose its underlying structure. Thursday's price action brought that distinction into focus. At the same time, weakness in Treasury yields and precious metals suggested that the selling was not confined to technology.
For traders, the opportunity is not in predicting the exact bottom. It is in identifying where the charts offer a defined setup, where the downside risk remains, and what price action would confirm that buyers are regaining control.
S&P 500 Technical Analysis: A Broken Trendline Changes the Near-Term Outlook
The S&P 500 entered Thursday attempting to maintain an ascending trendline that had provided support during recent sessions. Buyers initially defended the area, but the index ultimately broke below it and failed to reclaim the line on a subsequent rally.
Drew described the sequence as an attempted recovery that turned into bearish consolidation. Price moved back toward the broken trendline, encountered sellers, and spent much of the afternoon struggling to regain momentum.
That failed recovery matters more than the initial break. A trendline violation can produce a temporary shakeout, particularly when markets are already stretched to the downside. But when former support begins acting as resistance, it suggests that sellers are becoming more aggressive on rallies.
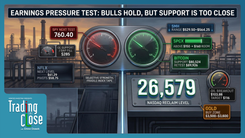
The next level Drew highlighted was 760.40 on the S&P 500 tracking chart, followed by a lower rising trendline near 748.45. These levels provide a framework for evaluating whether the decline remains controlled or begins developing into a more significant correction.
A sustained move below the first support area would leave the lower trendline as the next technical reference. Conversely, reclaiming the broken trendline and holding above it would weaken the immediate bearish interpretation.
The key is confirmation. A brief move below support is not necessarily a breakdown, just as a late-session bounce does not automatically signal a reversal. Traders need to see how price behaves around these levels before assigning greater conviction to either outcome.
Nasdaq Composite Breakdown: Why the Long-Term Channel Matters
The Nasdaq Composite showed greater relative weakness, falling approximately 2.6% during Thursday's session. Technology stocks had already been struggling to maintain a breakout above a declining trendline, and the latest selling pushed the index back toward its longer-term rising channel.
Drew compared the failed breakout to someone pulling themselves above a bar only to run out of strength. The index managed to clear resistance, but the buying pressure was not sufficient to sustain the move.
That analogy captures an important technical principle. Breaking resistance is only the first step. A successful breakout also requires buyers to defend the former resistance area when price returns to test it.
When that defense fails, the breakout can become a trap for traders who entered late, creating additional selling pressure as those positions are unwound.
The Nasdaq's rising parallel channel, which Drew traced back to April 2016, now becomes an important structural reference. If the index moves decisively back inside that channel, the next significant support identified in the analysis sits near 25,036.
That does not mean the index must trade directly to that level. Intermediate bounces remain possible, particularly after a sharp decline. However, the failure to hold above the descending trendline shifts the near-term burden of proof back to buyers.
For the broader market, this is significant because technology leadership has been an important component of the advance. If the Nasdaq cannot stabilize, a sustained recovery in the major indices becomes more difficult.
Semiconductor ETF SMH: A Potential Bounce at Fibonacci Support
While the Nasdaq breakdown reflects broader weakness, the semiconductor sector offers a more nuanced setup.
The VanEck Semiconductor ETF (SMH) has been among the important vehicles for tracking the strength of artificial intelligence infrastructure and semiconductor-related stocks. Thursday's selling brought the ETF back toward a technical area that Drew considers worth monitoring for a possible reaction.
The setup combines three factors: a 50% Fibonacci retracement measured from the March 2026 pivot low, a retest of a previously broken declining trendline, and an oversold reading on the daily Relative Strength Index.
Each factor carries information on its own, but the overlap is what makes the area interesting.
A Fibonacci retracement identifies a potential reaction zone based on the size of the preceding move. A trendline retest provides a structural reference, while an oversold RSI suggests that the recent selling has been unusually persistent.
Together, these conditions create a location where traders can look for evidence of buying interest. They do not establish that a bounce is inevitable.
Drew emphasized that technical patterns are useful because they provide repeatable frameworks, not guarantees. The next step is to determine whether price actually responds.
An initial move lower followed by a recovery back above support could strengthen the case for a short-term bounce. Continued selling through the confluence area, particularly without a meaningful intraday recovery, would suggest that the weakness has not yet run its course.
This is where trader discipline becomes important. Buying simply because an asset is oversold is different from entering after the market demonstrates that a support level is attracting buyers.
The SMH setup is worth watching precisely because it offers a way to evaluate that difference.
10-Year Treasury Yield and Gold: A Warning From Intermarket Divergence
One of the more important developments in Thursday's session came from outside the equity market.
The 10-year U.S. Treasury yield moved sharply lower, slipping beneath the 5.21% area and testing a declining trendline associated with a longer-term historical pivot. Drew also identified 5.289% as an important overhead reference, while the 5.021% region remains relevant to the broader technical structure.
The decline in yields would ordinarily be expected to provide some support for precious metals, particularly gold, because lower yields can reduce the opportunity cost of holding non-yielding assets.
That relationship did not hold during Thursday's session.
Gold and silver weakened alongside Treasury yields and equities, creating an intermarket divergence that deserves attention.
Drew raised the possibility that this combination could become part of a broader discussion about slowing economic growth. The interpretation requires caution, however. Falling yields can reflect changing growth expectations, increased demand for Treasuries, or a reassessment of monetary policy. Weakness in precious metals can also reflect positioning, profit-taking, or a demand for liquidity.
The important signal is not that a recession has been confirmed. It is that the usual relationships between assets were not providing the expected defensive behavior.
If yields continue declining while equities and precious metals remain under pressure, traders should watch whether the pattern reflects temporary liquidation or a more persistent shift in market expectations.
That distinction could matter considerably for the next phase of the equity market.
Gold and Silver Price Analysis: Support Levels to Watch After the Sell-Off
The weakness in precious metals has also changed the technical outlook for both gold and silver.
Gold broke below the \$4,100 area and traded toward \$4,021, leaving a bearish consolidation pattern on the chart. Drew identified the \$3,900 to \$3,950 region as the next meaningful support zone.
Below that, the \$3,885 pivot area and broader support extending toward \$3,800 become relevant. A larger continuation of the bearish pattern could eventually bring deeper levels into consideration, including the \$3,600 to \$3,500 region.
Those lower figures are potential chart objectives, not predictions that price must reach them.
For traders looking to establish long exposure, the important question is whether gold begins stabilizing at support or continues producing lower highs and lower lows.
Silver faces a similar challenge, although its chart structure is different.
After a substantial advance earlier in the year, silver has developed a potential head-and-shoulders topping formation. The neckline is now being tested, raising the possibility of a deeper retracement if the breakdown is confirmed.
Drew identified the area between \$53.26 and \$50 as an important region to monitor, partly because of historical price structure around the \$50 level. A more extensive decline could eventually bring the lower boundary of the broader channel, near \$36, into focus.
The lesson across both metals is the same. A significant decline can improve the location of a potential long-term entry, but price reaching support does not eliminate the possibility of further downside.
The strongest setups develop when a meaningful level is accompanied by evidence that selling pressure is beginning to exhaust itself.
Crude Oil and Natural Gas: Different Technical Setups in Energy Markets
Energy markets presented a different picture from technology and precious metals.
Crude oil maintained relative strength during Thursday's session, advancing approximately 1.4% despite weakness across several other asset classes.
Drew discussed geopolitical supply concerns as an important consideration for oil, particularly the potential impact of disruptions affecting Middle Eastern production and transportation routes.
On the chart, crude continues to display a larger inverse head-and-shoulders structure. The immediate resistance area sits near \$104, while the broader measured-move objective remains around \$116.12 if the bullish pattern confirms.
A sustained breakout above resistance would strengthen that technical case. Failure to clear the level could leave oil consolidating despite the geopolitical risk premium.
Natural gas, meanwhile, remains sensitive to weather expectations and seasonal demand.
Forecasts suggesting a milder beginning to November have contributed to weakness, leaving natural gas trading within a narrowing technical structure. Drew highlighted the \$3.20 area as an important lower reference and \$3.65 as a level to monitor for a potential recovery.
Rather than assuming that winter demand will automatically push prices higher, traders should watch whether natural gas can stabilize and begin reclaiming resistance.
The contrast between crude oil and natural gas illustrates why the energy sector cannot be treated as a single trade. Different supply dynamics, demand expectations, and chart structures can produce very different outcomes.
Technology Stocks vs. Defensive Stocks: What Market Rotation Reveals
The contrast between technology weakness and defensive strength was particularly visible in Procter & Gamble (PG).
Following its earnings report, PG broke above a declining parallel channel that had been in place since March 2025. That move stood out against the selling across technology and other growth-oriented areas.
However, the breakout also pushed the stock into an overbought condition, with Drew identifying a daily RSI near 74.46.
An overbought reading does not automatically mean a stock must decline. Strong stocks can remain overbought during sustained advances. But when that condition develops near historical resistance, traders have reason to be more selective about new entries.
For PG, the next confirmation would be a daily close above Thursday's high, followed by an ability to defend the breakout area on a pullback. The broader resistance region between \$180 and \$190 remains relevant if momentum continues.
The larger lesson is that defensive strength does not make every defensive stock an attractive entry at any price.
Meanwhile, several individual stocks illustrated how quickly market leadership can deteriorate.
GE Vernova (GEV) suffered a sharp decline after failing to reclaim a broken technical structure. The sequence of breakdown, retest, and rejection provided a clear example of former support becoming resistance.
Sandisk (SNDK) also closed beneath its rising parallel channel after an unsuccessful attempt to recover the broken boundary. That places greater importance on the next support test and whether buyers can prevent additional downside.
Western Digital (WDC) showed significant volatility around its earnings release. Drew highlighted a potential support cluster around \$320, \$312, and the \$307 to \$301 region. These overlapping references become more useful if selling continues and price begins approaching them.
Bloom Energy (BE) was another example of weakening structure. After testing support around \$200 to \$201.79, the stock struggled to sustain its recovery. A confirmed break below the channel would shift attention toward the \$188.37 Fibonacci reference.
These individual setups reinforce the broader market message. When momentum deteriorates, the quality of the entry matters more than the size of the preceding decline.
Bitcoin Technical Analysis: \$80,500 Support and the Risk of \$75,000
Bitcoin also reflected the broader pressure on risk assets.
The cryptocurrency has been developing a bearish consolidation pattern while repeatedly testing support around \$80,500. Attempts to recover the upper portion of its recent trading range have not produced a sustained reversal.
Drew used a simple analogy to explain the significance of repeated support tests: the more often price knocks on the same door, the greater the concern that the level may eventually give way.
Repeated tests are not automatically bearish. Strong support can absorb selling pressure multiple times. However, when each recovery becomes weaker and price repeatedly returns to the same floor, the balance between buyers and sellers can begin to shift.
For Bitcoin, a confirmed break below \$80,500 would bring the \$75,000 region into focus as the next major technical reference.
Conversely, holding support and reclaiming the upper half of the recent trading range would provide evidence that buyers are regaining control.
The connection to equities also deserves attention. If technology stocks remain under pressure and risk appetite continues weakening, Bitcoin may struggle to establish an independent recovery.
That relationship is not permanent, but it is relevant to the current market environment.
Stock Market Outlook: What Traders Should Watch Next
Thursday's selling created several important tests for the next trading session.
The first is whether the S&P 500 and Nasdaq can reclaim their broken technical levels. A recovery that holds above former support would suggest that the recent breakdown may have been temporary. Another failed retest would reinforce the bearish near-term structure.
The second is whether semiconductor stocks can attract buyers around the SMH Fibonacci confluence area. Because semiconductors have been important market leaders, their response could provide useful information about the strength of any broader rebound.
The third is the behavior of Treasury yields and precious metals. Continued weakness across these markets would deserve attention, particularly if the normal relationships between defensive assets and equities remain disrupted.
Finally, traders should remain aware of geopolitical developments and the potential for price gaps between sessions. Such events can change the market's technical picture before traders have an opportunity to react.
Drew's approach throughout the show was consistent: identify the level, understand the setup, and wait for the market to provide evidence.
That framework becomes especially valuable when volatility increases.
Trading the Close: Why Patience Matters More Than Predicting the Bottom
The most important takeaway from Thursday's Trading the Close is not that every chart has turned bearish or that another major decline is inevitable.
It is that the market has entered a period where confirmation matters more than anticipation.
The Nasdaq's failed breakout, the S&P 500 trendline violation, and the pressure on semiconductor leadership all suggest that buyers have work to do. At the same time, oversold conditions and approaching support levels could create opportunities for technical rebounds.
Both possibilities can exist simultaneously.
For traders, that means avoiding two common mistakes: assuming every bounce marks the beginning of a new rally and assuming every sharp decline will continue without interruption.
Drew's emphasis on patience is particularly relevant here. Waiting for a stock or index to reach a predetermined support zone is only part of the process. The next step is assessing how price behaves once it arrives.
A disciplined trader does not need to catch the exact low to participate in a recovery. Nor does a trader need to chase a breakdown after the majority of the initial move has already occurred.
The market will provide another setup. The priority is making sure the risk is defined when that opportunity appears.
Bottom line: The technical damage from Thursday's sell-off should not be ignored, but neither should the potential for a rebound as important support levels approach. The next move will be determined by whether buyers can defend those levels and reclaim lost ground. Until then, patience and confirmation remain more useful than conviction without evidence.
Disclaimer: Trading and investing involve substantial risk, including the possible loss of principal. This article is provided for educational and informational purposes only and does not constitute financial advice or a recommendation to buy or sell any security, commodity, or cryptocurrency. Technical patterns and price targets are not guarantees of future performance. Conduct your own research and consider your financial circumstances and risk tolerance before making trading decisions.
Trading involves substantial risk. All content is for educational purposes only and should not be considered financial advice or recommendations to buy or sell any asset. Read full terms of service.