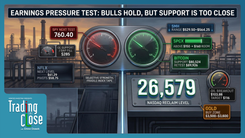
Trading The Close Market Recap - 10/21/2026: Earnings Surge Lifts Tech; Tesla & Semiconductors at Key Technical Tests

Nasdaq Reclaims Key Level as Earnings Volatility Tests Market Resistance
Trading the Close Market Recap | October 21, 2026
The stock market moved higher Wednesday, but the more important development was where the major indexes finished relative to their technical levels. The S&P 500 gained 0.53%, while the Nasdaq recovered a key area that had challenged buyers for several sessions. That improvement gives bulls something to work with heading into Thursday, although the next session will determine whether the recovery has staying power.
During Wednesday's Trading the Close, Verified Investing Pro Trader Drew Dosek examined the improving index structure, the hesitation in semiconductors, and several individual stocks approaching important technical levels. His central message was that a strong session can improve a chart without resolving every risk. With earnings producing sharp moves in individual names, the advantage comes from identifying where price is likely to encounter buyers or sellers before the next catalyst arrives.
That framework becomes particularly important when the major indexes look stronger than some of the sectors supporting them. The Nasdaq has made progress, but semiconductor consolidation and overhead resistance in major technology stocks suggest traders still need confirmation before treating the recovery as a broader breakout.
S&P 500 and Nasdaq Technical Analysis: Bulls Regain Control of Key Levels
The S&P 500's 0.53% advance carried more technical significance than the percentage alone suggests. For four consecutive sessions, the index had been pressing against an inclining support trend line. Repeated tests of support can weaken a level, particularly when buyers struggle to generate meaningful separation from it.
Wednesday's advance finally created some distance between price and that trend line. That gives the bullish structure additional room, although the next test will come if sellers return. A successful retest would strengthen the case that buyers remain in control. A decisive move back below support would put the recent recovery in question.
The Nasdaq offered an even clearer example of this shift. Drew compared Monday's and Tuesday's candles to someone hanging from a pull-up bar, struggling to get back above an important level. Wednesday's action finally pushed the index back over that technical barrier.
The recovery is constructive, but the confirmation still lies ahead. Drew identified 26,786 as the level the Nasdaq needs to close above to strengthen the bullish case. On the downside, a break below 26,582 would undermine Wednesday's improvement and bring renewed selling pressure into focus.
The lesson is straightforward: reclaiming a level is the first step. Holding it and building on that recovery is what gives the move greater significance.
Semiconductor ETF SMH: Bear Flag Risk Beneath the Nasdaq Rally
One reason to remain selective is the semiconductor sector. The VanEck Semiconductor ETF (SMH) gained 1.89% Wednesday, but that advance has not yet resolved the larger technical structure.
SMH has spent approximately five sessions consolidating after a sharp decline. That combination raises the possibility of a developing bear flag, a continuation pattern that can point to additional weakness if price breaks below its lower boundary. Drew noted that another couple of sessions of sideways movement could further develop the pattern.
If sellers regain control and confirm a breakdown, the lower boundary of an inclining parallel channel near \$529.26 becomes an important downside reference. A deeper declining trend line would come into focus if that support fails.
However, the bearish interpretation remains conditional. A sustained move above the consolidation range would weaken the bear flag scenario and suggest buyers are regaining control.
This is the divergence traders should watch. The Nasdaq's recovery is encouraging, but a stronger advance would carry more weight if semiconductor stocks begin confirming the move rather than simply recovering within a potentially bearish structure.
10-Year Treasury Yield: Historical Resistance Adds Another Market Variable
The bond market provides another piece of the broader technical picture. The 10-year Treasury yield has been relatively flat after approaching a historical resistance area associated with pivot highs from June 2007.
Drew highlighted a developing candlestick structure he describes as a "sleeper hold," where momentum begins to stall near an important technical level. The significance is not that yields must reverse, but that buyers have encountered an area where previous price action suggests resistance may develop.
When historical resistance, candlestick behavior, and a mature time count begin aligning, the potential for a directional turn deserves attention. That is particularly relevant for technology stocks, where changes in Treasury yields can influence valuation expectations and risk appetite.
A confirmed retreat in yields could provide a more supportive backdrop for growth stocks. A sustained breakout through resistance, on the other hand, would require traders to reassess that assumption.
Drew's broader point was about recognizing turning points before the move becomes obvious. The opportunity is not in predicting every top or bottom. It is in identifying a defined technical area, waiting for confirmation, and managing the risk if price moves in the opposite direction.
Tesla Stock Technical Analysis: Four Resistance Levels Converge Near \$400
Tesla (TSLA) presents one of the clearest examples of why multiple technical factors matter more than any single resistance line.
Drew identified a cluster of four barriers concentrated around the psychologically important \$400 level. These include a declining trend line from December 2025 near \$394.24, a 50% Fibonacci retracement at \$398.11, a broken inclining trend line near \$399.04, and another inclining trend line approaching \$400.
Individually, each level represents potential resistance. Together, they create a relatively narrow area where sellers may become more active, particularly if price approaches the zone following a strong advance.
The next important upside reference is \$403.78. A sustained move above that level would suggest Tesla has cleared the immediate resistance cluster and could bring \$421.88 into focus.
If price fails to break through, the stock may need additional consolidation before attempting another advance. A rejection would also raise the possibility of a pullback as traders respond to the concentrated overhead resistance.
The important distinction is that the resistance cluster identifies where the next decision may occur. It does not establish the outcome in advance.
IBM and Meta Earnings: Why Price Levels Matter More Than the Initial Reaction
Earnings season has introduced another layer of uncertainty, with individual stocks experiencing sharp moves outside regular trading hours.
IBM closed the regular session near \$251 before trading substantially higher after hours, reaching a reported high of \$271.29. Drew also identified an unusual intraday price spike toward \$310 ahead of the earnings release.
That isolated move warrants closer examination, but it does not, by itself, establish that information leaked or that improper trading occurred. Unusual prints can also reflect liquidity conditions, reporting errors, or other market mechanics.
From a technical perspective, IBM's more immediate issue is the resistance surrounding the 50% Fibonacci retracement at \$265.83. If the stock opens below that level, the area becomes an important test for buyers attempting to sustain the earnings-driven advance.
A move above resistance would shift attention toward the 61.8% retracement at \$281.55. Failure to hold the initial breakout area could instead produce a retracement of the after-hours move.
Meta Platforms (META) offers a different setup. The stock closed near \$697.52 before trading around \$737 after hours, following several sessions in which buyers appeared to defend support within an inclining parallel channel.
The October 19 and 20 candles showed pronounced lower wicks around the channel's midpoint. Those wicks suggest that selling pressure was met with buying interest near an established technical area. The October 20 candle also closed within the previous day's body, reinforcing the importance of the support zone.
The subsequent recovery is consistent with a successful support test. Looking higher, Drew identified previous pivot resistance near \$771, followed by \$780.
IBM and Meta illustrate two sides of the same earnings environment. One is approaching resistance following a sharp move, while the other is recovering from a technically significant support area. In both cases, the next reaction at a predetermined level matters more than the initial excitement surrounding the earnings move.
Gold and Silver Price Analysis: Short-Term Weakness Meets Longer-Term Support
Precious metals are showing why timeframe selection matters when evaluating a technical setup.
Gold remains in a short-term consolidation pattern that resembles a bear flag. Buyers have repeatedly defended the \$4,100 area, leaving lower candle wicks that suggest demand is present near support. However, the broader short-term pattern still carries downside risk if that level breaks.
Drew identified \$3,950 as the next downside reference following a confirmed breakdown. On a larger timeframe, an inclining trend line near \$3,650 represents another potential support area, while \$3,500 is a longer-term level worth monitoring.
These levels are not automatic buying signals. They identify areas where traders and longer-term investors can evaluate whether price begins stabilizing, whether momentum is improving, and whether the risk relative to potential upside becomes more favorable.
Silver presents a similar timeframe conflict. A shorter-term bull flag has developed within a larger bearish structure, creating competing signals depending on which chart is being evaluated.
The larger pattern continues to point toward a potential head-and-shoulders measured move near \$53.26. Drew also highlighted the \$50 area as a longer-term reference for evaluating physical silver accumulation.
The takeaway is not that gold or silver must decline to these levels. It is that a short-term bounce can occur within a larger correction, and traders need to know which timeframe governs their decision.
Crude Oil and Natural Gas: Support Levels Face Fundamental Catalysts
Crude oil has paused near its September 18 pivot high after an extended advance. That hesitation does not necessarily invalidate the bullish structure.
Drew compared the move to climbing a mountain. A climber may stop to recover before attempting the next section, and markets can behave similarly after a sustained rally. Consolidation near resistance can allow price to absorb selling pressure before the next directional move.
An inverse head-and-shoulders formation remains part of the bullish technical case, with a measured move objective near \$116. However, that target depends on the pattern remaining intact and price confirming the necessary breakout.
Geopolitical developments in the Middle East remain an important variable for crude oil. Any escalation affecting supply expectations could influence prices, although the timing and direction of such developments cannot be assumed from the chart alone.
Natural gas faces a different set of catalysts. The market declined Wednesday amid discussion of milder weather expectations and their potential effect on heating demand. Price has moved back toward a support area formed by a previous pivot high and an inclining trend line.
That confluence gives traders a defined area to monitor, particularly with the next inventory report approaching. A successful defense of support could preserve the recent breakout structure, while a decisive breakdown would weaken the bullish setup.
Natural gas has earned its reputation as the "Widow Maker" because of its capacity for sharp, unpredictable moves. Drew emphasized the importance of keeping position sizes manageable so traders can respond to volatility without becoming overextended.
The point applies well beyond natural gas. A technically attractive setup is only useful when the potential loss remains manageable if the analysis proves wrong.
Baidu Stock Analysis: Multiple Support Factors Converge Near \$75
Baidu (BIDU) was among the more interesting individual stock setups discussed Wednesday, not because its chart has already turned bullish, but because the decline is approaching an unusually concentrated support area.
According to Drew's chart, Baidu has fallen from approximately \$152 in May 2026 to \$78.82, a decline of roughly 48%. That move has brought the stock toward several technical references that could influence the next directional decision.
The first is a gap-fill area near \$78.47. Below that sits a multi-year inclining trend line connecting the October 2022 and April 2025 lows, currently near \$75.86. Additional historical pivot support appears around \$74.71 and \$73.58.
The weekly Relative Strength Index (RSI) is near 32.32, indicating weakened momentum and a market approaching traditionally oversold territory. Drew also identified a mature count of consecutive declining weekly candles.
Together, these factors create a potential support zone extending from approximately \$78.47 into the low \$73 area. The importance lies in the convergence of different technical references rather than any guarantee that buyers will appear.
A stabilization pattern or bullish reversal from this region could bring an initial recovery toward \$89 into focus. Conversely, a sustained break below the support cluster would weaken the bounce thesis and require a fresh assessment of downside risk.
This is an example of how professional traders approach a falling stock. A large decline alone is not a reason to buy. The stronger setup develops when price reaches a planned support area and begins showing evidence that selling pressure is losing control.
Bitcoin Technical Analysis: \$85,000 Support and \$89,900 Resistance
Bitcoin gained approximately 1.88% Wednesday, but its next technical challenge remains clearly defined.
Drew identified \$85,000 as an important level for the cryptocurrency to reclaim and hold. A period of consolidation between \$85,000 and \$86,500 would help establish a stronger base for another potential advance.
If buyers can maintain that area, attention shifts toward \$89,900, where an inclining trend line intersects the neckline region of an earlier head-and-shoulders formation.
A sustained move above that neckline would weaken the bearish interpretation of the previous pattern. It would also suggest buyers are regaining control of an area that had previously carried technical significance.
Failure to hold the \$85,000 region would produce a different conclusion, leaving the recovery vulnerable to renewed selling.
The important lesson is that technical patterns evolve. A bearish setup can lose validity when price reclaims its critical levels, just as a bullish setup can fail when support breaks. Traders need to respond to those changes rather than remain committed to an outdated directional bias.
Trading Risk Management: Why Patience Matters More Than Predicting the Turn
Across Wednesday's charts, the same principle kept appearing: the strongest potential opportunities often develop where several technical factors converge, but identifying those areas is only the beginning.
Tesla is approaching concentrated resistance. Baidu is approaching concentrated support. The Nasdaq has reclaimed an important level, while semiconductors have not yet confirmed the broader recovery. Gold and silver are balancing short-term patterns against longer-term technical structures.
These are different markets, but the decision-making process remains consistent. Identify the level, understand the conditions that support the thesis, determine what would invalidate it, and manage exposure accordingly.
Drew also discussed the upcoming BitFunded Crypto Combat competition, which will allow participants to compare their trading decisions with Verified Investing's Pro Traders. The competition provides another setting in which discipline, position sizing, and consistency can be evaluated under defined rules. Participants should review the entry costs, account structure, eligibility requirements, and trading restrictions before taking part.
Whether trading a competition account or personal capital, the same risk-management principles apply. A well-defined technical setup does not eliminate losses, and no single opportunity should be large enough to compromise the ability to trade another day.
Market Outlook for October 22: Key Levels Traders Should Watch
Thursday's session will help determine whether Wednesday's improvement develops into a more convincing market recovery.
For the Nasdaq, a close above 26,786 would strengthen the bullish technical case, while a move below 26,582 would challenge it. Semiconductor performance will be particularly important in evaluating whether the recovery is broadening or remains concentrated in a narrower group of stocks.
In individual equities, Tesla's resistance cluster around \$394 to \$404 and IBM's \$265.83 Fibonacci level provide clearly defined decision areas. Baidu's support region between approximately \$73 and \$78 remains a potential area to monitor for signs of stabilization.
Outside equities, gold's \$4,100 support, the next natural gas inventory report, and Bitcoin's ability to hold above \$85,000 will provide additional information about market direction and risk appetite.
The broader takeaway from Wednesday's Trading the Close is that the market has improved, but confirmation remains uneven. The S&P 500 and Nasdaq have taken constructive steps, while semiconductor hesitation and significant overhead resistance in individual stocks continue to warrant caution.
The next opportunity is not necessarily the next breakout. It is the next well-defined setup where price, confirmation, and risk align.
Trading involves substantial risk. All content is for educational purposes only and should not be considered financial advice or recommendations to buy or sell any asset. Read full terms of service.