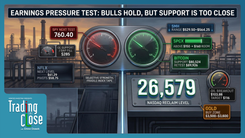
My Trading Game Plan Revealed - 10/22/2026: Markets Slide as $100 Oil and Falling Yields Roil Tech Stocks

Oil Near \$100 Pressures Stocks as Treasury Yields Fall, Tech Earnings Disappoint
The NASDAQ is down nearly 2% this morning, while the S&P 500 is trading approximately 1% lower following earnings reactions from major technology companies. The selling comes as oil remains near \$100 per barrel and Treasury yields continue to decline, creating a difficult backdrop for equities. In today's My Trading Game Plan Revealed, Gareth Soloway, Chief Market Strategist at VerifiedInvesting.com, focused on the growing economic pressure from sustained energy costs and the technical levels that could offer trading opportunities during the pullback.
The broader concern centers on how long consumers and businesses can absorb elevated energy prices before economic growth begins to weaken more noticeably. Falling bond yields suggest that investors are increasingly weighing that possibility, even as oil remains high enough to sustain inflationary pressure. Gareth's framework still allows for another move higher in the S&P 500, potentially toward 8,000, but the path becomes more difficult if energy costs remain elevated. Against that backdrop, earnings volatility is creating specific technical setups in Meta, Tesla, Lam Research, and other heavily traded stocks.
Oil Near \$100 Becomes a Growing Risk for the S&P 500
Crude oil continues to trade near \$100 per barrel, holding elevated levels despite relatively limited movement over the past several sessions. Gareth emphasized that the duration of this price environment is becoming increasingly important for the economy. A brief geopolitical spike can be absorbed more easily than several months of sustained pressure, particularly when higher fuel and transportation costs begin working their way through household budgets and business expenses.
Gareth noted that oil has averaged approximately \$95 per barrel since its initial surge in February. That sustained average carries consequences beyond the daily movement in crude futures. Higher diesel prices increase transportation and distribution costs, while expensive gasoline reduces the money consumers have available for other purchases. Each additional week at these levels adds pressure, creating the cumulative economic damage Gareth described as "death by 1,000 cuts." The longer this continues, the greater the risk that consumer spending slows and corporate margins come under pressure.
For the S&P 500, the technical picture still leaves room for a move toward the 8,000 level. A decline of approximately 1% brings the index back toward prices seen earlier in the week, so the current pullback alone does not establish a larger bearish reversal. However, Gareth sees a meaningful reduction in oil prices, potentially toward \$70 to \$80 per barrel, as an important development that could improve the outlook for equities. If crude remains near \$100 for an extended period, recession risks increase and the bullish scenario faces a more challenging economic backdrop.
Falling 10-Year Treasury Yields Signal Economic Growth Concerns
One of the more important developments in Gareth's analysis is the divergence between crude oil and the 10-year Treasury yield. Elevated oil prices can contribute to inflation expectations and upward pressure on yields. Yet the 10-year yield is moving lower even as energy costs remain stubbornly high. That relationship suggests the bond market may be placing greater weight on the possibility of slowing economic growth and weaker demand.
The technical chart reinforces that interpretation. Gareth previously identified a bear flag and a potential head and shoulders pattern in the 10-year yield, both suggesting vulnerability to further downside. With yields now breaking lower, the price action supports the view that growth concerns are becoming more influential. Investors may be anticipating an environment where weaker economic activity eventually increases pressure on the Federal Reserve to ease monetary policy.
The implications for equities are important. Lower Treasury yields can sometimes support stock valuations by reducing borrowing costs and discount rates. However, when yields decline because investors expect economic conditions to deteriorate, the benefit can be offset by concerns about earnings and consumer demand. Gareth's focus is on that developing relationship. Continued weakness in yields alongside elevated oil prices would strengthen the case that the market is beginning to price in economic damage from prolonged energy costs.
Meta Stock: Earnings Reaction Puts \$666 and \$650 Support in Focus
Meta Platforms (META) is trading lower following its earnings report, with shares indicated around \$680 during Gareth's morning analysis. Although the company's results were reasonably strong, investors appear concerned about the financial demands of its artificial intelligence expansion. Significant infrastructure spending, additional borrowing, and pressure on near-term cash flow are changing how the market evaluates a business historically associated with substantial cash generation.
The concern reflects the growing cost of competing in artificial intelligence. Companies are committing large amounts of capital to data centers, computing infrastructure, and related technology, while the timing of future returns remains uncertain. For Meta, that creates additional scrutiny around spending and cash flow even when the underlying business continues to perform. Gareth approached the earnings reaction through the technical chart, identifying levels where selling pressure could begin to encounter support.
The first area sits near \$666, where a gap fill creates a potential technical reaction point. If shares continue lower, a descending trend line near \$650 provides another area of interest. These levels offer a framework for evaluating a possible day trading bounce, with the quality of the reaction determining whether buyers are willing to defend support. A sustained break below either level would weaken the corresponding setup and shift attention toward lower prices.
Tesla Stock: Parallel Channel Rejection Points Toward \$350 Support
Tesla (TSLA) initially moved higher following its earnings release before reversing during overnight trading. Gareth highlighted the technical structure behind that reaction, particularly the stock's approach to the upper boundary of an established parallel channel. Price reached that resistance area heading into earnings, leaving the stock vulnerable to selling if the announcement failed to generate enough buying demand to support a breakout.
The rejection illustrates how technical resistance can influence price action around major catalysts. Earnings releases often produce significant volatility, but a stock approaching a well-established resistance level may already reflect considerable optimism. When price fails to clear that area, traders who bought ahead of the event can begin exiting positions, adding to the selling pressure. In Tesla's case, the parallel channel provided a useful reference for understanding the reversal.
Gareth identified a potential support area around \$353 to \$350, based on a trend line drawn from a recent pivot low. That zone sits roughly \$20 below the price area discussed during the broadcast, a distance that remains relevant given Tesla's typical trading volatility. If shares decline toward support, Gareth's framework calls for evaluating the price reaction rather than assuming the level will automatically hold. A decisive break below the zone would reduce the appeal of the initial bounce setup.
Lam Research Stock: Earnings Selloff Brings \$224 Gap Fill Into View
Lam Research (LRCX) is experiencing a substantial decline despite reporting strong earnings and revenue. The semiconductor equipment manufacturer faced elevated expectations tied to artificial intelligence spending, leaving investors focused on whether forward guidance could support the stock's valuation. Although the reported results were strong, the outlook appears to have fallen short of the higher expectations embedded in the share price.
The reaction highlights the role of unofficial earnings expectations, commonly described as the "whisper number." When a stock has already experienced a significant rally, investors may expect results that exceed published estimates by a wide margin. Meeting or modestly exceeding consensus forecasts can still produce selling if the outlook fails to justify those expectations. Gareth noted that Lam Research had fallen from approximately \$350 on October 2 to around \$234, representing a decline of roughly one-third in less than a month.
From a technical perspective, Gareth identified a significant gap fill near \$224, approximately \$10 below the price discussed during the show. That level offers a potential day trading long setup if additional selling brings shares into the area. The size of the preceding decline could create conditions for a short-term rebound, particularly if selling begins to exhaust itself near support. However, a sharp decline can also continue through an established level, making confirmation and disciplined risk management important parts of the setup.
Spotify Stock Shows Relative Strength With \$576 Resistance Ahead
Spotify (SPOT) stands out against the weakness affecting many technology stocks. Shares closed the previous session near \$525 before moving toward \$563 following earnings, demonstrating relative strength while the broader market traded lower. Gareth highlighted this divergence because stocks that hold up during market weakness can attract additional buying interest if overall conditions stabilize.
Relative strength can provide useful information about institutional demand and investor positioning. A stock that advances while major indexes decline is demonstrating that buyers are willing to commit capital despite the broader selling pressure. If the market subsequently rebounds, that existing demand can support additional upside. However, the strength of the initial move also creates the possibility that traders buying late encounter nearby resistance.
For Spotify, Gareth identified \$576 as an important pivot-high resistance level. That area could produce a short-term trading opportunity if shares continue higher and begin showing signs of rejection. The preferred approach is to let price reach the technical level and evaluate the reaction. Chasing a large earnings gap before resistance is tested can leave traders exposed to a reversal, particularly when broader market conditions remain unsettled.
Gold Breaks \$4,065 Support as Silver Approaches \$50 Buy Zone
Precious metals are also showing technical weakness, with gold and silver extending their recent declines despite concerns about the economic outlook. Gareth highlighted gold's confirmed breakdown below the \$4,065 to \$4,066 support area, a development that changes the near-term chart structure. Once an established support level fails, traders often begin evaluating lower areas where buyers previously demonstrated interest.
The next significant support for gold sits near \$3,950. Gareth sees that area as an important potential reaction point following the breakdown. If selling continues and \$3,950 fails to hold, the chart leaves room for a deeper decline toward approximately \$3,500. These are conditional downside reference points rather than guaranteed targets, with price behavior at each support area determining whether the bearish structure remains intact.
Silver has also weakened, confirming a wedge breakdown followed by a bear flag pattern. With prices retreating toward \$55, Gareth continues to favor patience for traders looking for a larger support area. His preferred zone sits around \$50, including the possibility of a brief move below that level before buyers emerge. The attraction of that area comes from the potential relationship between entry price, nearby support, and downside risk. A sustained failure to reclaim \$50 after a breakdown would require reassessing the setup.
Natural Gas Reaches Trend Line Support After Sharp Decline
Natural gas is beginning to rebound after a prolonged period of selling pressure, providing a contrast to crude oil's sustained strength. Gareth noted that prices have reached a significant technical trend line, creating the possibility of a short-term reaction. The bounce comes as traders also evaluate inventory data, which can influence near-term supply expectations and volatility.
The trend line is the primary reference point for the setup. If natural gas holds support and begins establishing higher lows, the rebound could develop into a broader mean-reversion move. If the initial bounce fades and price breaks below the trend line, the technical picture would remain weak. Gareth's analysis centers on whether buyers can defend the area after the recent decline, with subsequent price action providing the confirmation.
Bitcoin Price Outlook: \$81,000 Support and \$87,200 Resistance
Bitcoin (BTC) has returned to choppy trading after showing strength over the previous two sessions. Gareth described the current environment as difficult for short-term traders because repeated moves in both directions have failed to establish a sustained trend. This type of range-bound price action can produce false breakouts and rapid reversals, particularly when leveraged positions are concentrated around obvious technical levels.
The chart provides two boundaries that define the next meaningful directional opportunity. On the downside, a daily close below \$81,000 would strengthen the bearish case and open the possibility of a decline toward \$75,500. On the upside, a confirmed breakout above \$87,200 would improve the bullish structure and bring \$95,000 into focus as a potential target. Gareth emphasized the importance of waiting for confirmation because brief moves beyond support or resistance can quickly reverse.
Between those levels, Bitcoin remains vulnerable to the same back-and-forth trading that has frustrated participants during the recent consolidation. Traders attempting to capture every move inside the range face greater exposure to whipsaws and repeated losses. Waiting for a confirmed break offers a clearer directional framework, although even confirmed moves can fail. For Gareth, preserving capital during uncertain conditions remains an important part of the trading process.
BitFunded Trading Competition Begins October 23
Verified Investing is also preparing for a three-week trading competition with BitFunded, scheduled to begin October 23 in connection with the Crypto Combat show. The event is designed around competitive trading, with participants able to compare performance on a public leaderboard while applying technical analysis and risk-management principles.
According to the competition details discussed in the supplied recap, the entry fee is \$79 and participation includes access to a \$10,000 trading account and a separate \$5,000 practice account. The announced prizes include funded-account awards, cash prizes, and an iPhone 18 Pro for the top finisher. Participants should review the official competition rules, account conditions, payout requirements, eligibility restrictions, and applicable fees before entering. Funded-account awards should not be interpreted as cash prizes or guaranteed withdrawable balances, and trading results do not guarantee profits.
Trading Game Plan: Key Support Levels and Confirmation
The broader market decline is creating potential short-term trading setups, but Gareth's approach remains centered on waiting for price to reach predefined technical areas. Meta's \$666 gap fill, Tesla's \$350 to \$353 support zone, and Lam Research's \$224 gap fill are examples of locations where traders can begin evaluating the balance between buyers and sellers. Each setup depends on how price behaves when the level is tested, especially during a session where market-wide selling pressure can overwhelm individual support areas.
At the macro level, crude oil near \$100 and declining Treasury yields remain central to Gareth's outlook. A meaningful retreat in oil prices could ease some of the pressure on consumers and improve the environment for equities. Continued strength in crude alongside weakening growth expectations would increase the risk of a broader market adjustment. Meanwhile, gold's breakdown and Bitcoin's established range provide additional confirmation levels to monitor across asset classes.
The trading advantage in this environment comes from preparation and selectivity. Volatile markets can create sharp rebounds, but a large decline alone does not establish a buying opportunity. Gareth's framework favors identifying support and resistance in advance, allowing price to reach those areas, and using the subsequent reaction to assess whether a trade offers a reasonable balance of risk and potential reward. With earnings volatility elevated and macroeconomic pressures building, patience remains as important as identifying the right chart.
Disclaimer: This article is provided for educational and informational purposes only and does not constitute financial or investment advice. Trading and investing involve substantial risk, including the potential loss of principal. Technical levels and price targets are conditional, may not be reached, and do not guarantee future performance. Always conduct your own research and consider your financial circumstances and risk tolerance before making trading decisions.
Trading involves substantial risk. All content is for educational purposes only and should not be considered financial advice or recommendations to buy or sell any asset. Read full terms of service.