My Trading Game Plan Revealed - 11/05/2025: Semiconductor Overextension Warns of Imminent Market Correction

In this morning's My Trading Game Plan show, Gareth Soloway, Chief Market Strategist at Verified Investing, issued a stark warning: the markets have entered a danger zone. Despite a slightly better-than-expected ADP jobs report providing a brief pre-market lift, significant technical warning signs, particularly in the semiconductor sector, suggest a major correction could be on the horizon. As earnings from key players like AMD and SMCI add to the sector's weakness, we'll dive deeper into the charts that signal this inflection point, the psychology required to navigate it, and the key levels traders must watch across multiple asset classes.
The Semiconductor Canary in the Coal Mine
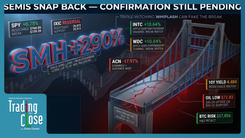
The semiconductor sector, the undisputed leader of the market's recent bull run, is flashing a historical warning sign that is impossible to ignore. The VanEck Semiconductor ETF (SMH) has reached a point of extreme overextension that has preceded major corrections twice before. This isn't about hype or narrative; it's about historical precedent and the cyclical nature of greed and fear reflected in the charts.
As Gareth explained, the pattern is remarkably consistent:
- In 2021, the SMH peaked at 102% above its 200-day moving average before collapsing.
- In 2024, it again reached 102% above the 200-day moving average before a sharp decline.
- Just recently, the SMH once again tagged that same 102% extension level and is now beginning to roll over.
This repetition is the essence of technical analysis. "Everyone loves to say this time is different. But in reality, we know that history, while it may not perfectly mimic, it often rhymes. And that's, again, something that leads me to believe the semis are at an inflection point for a rollover." This isn't a random occurrence; it's a quantifiable measure of how far a sector has moved from its long-term mean. When these extremes are reached, a reversion to that mean becomes not just possible, but probable.
For traders, this doesn't mean blindly shorting the market. It means identifying where the potential floor might be. A logical first target for a correction in the SMH would be the prior highs from 2024, a level that served as a springboard for the most recent surge. This area, around the 284 level, represents a significant technical confluence zone that will likely attract buyers if and when the correction unfolds.
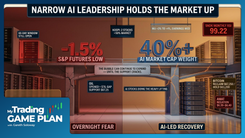
A Broader Market in the Danger Zone
While the semiconductors are the most glaring warning, the S&P 500 is painting its own cautionary picture. On the weekly chart, a massive trendline connecting the 2021 bull market high and the more recent highs has once again acted as formidable resistance. The candle currently forming for this week has the potential to be a major reversal signal, following last week's "topping tail" candle, which indicated a rejection of higher prices.
This ominous technical setup is occurring despite some seemingly positive news. The ADP private sector jobs report came in at 42,000 jobs added, slightly beating the 32,000 forecast. This, combined with chatter about a potential end to the government shutdown, provided a temporary lift. However, these are likely minor, short-term catalysts against a much larger and more powerful technical backdrop. As Gareth noted, a government reopening would likely be a "one-day catalyst for a bounce" rather than a fundamental shift in the market's trajectory.
The key takeaway is that the underlying structure of the market is showing signs of fatigue. Valuations are stretched, and the charts are signaling that the momentum that carried equities higher is waning at critical long-term resistance levels.
The Psychology of Detachment: A Trader's Most Valuable Asset
In markets defined by euphoria and fear, the ability to remain emotionally detached is paramount. This is especially true when dealing with popular, high-flying stocks that investors often become deeply attached to. Gareth shared a crucial piece of wisdom honed over decades of trading: "never love something that… won't love you back. And a stock or an ETF is not going to love you back."
This principle is vital for survival. We've seen this story play out time and time again. Investors fell in love with Tesla during its historic run in 2021, only to see it correct by 75% in 2022. The same emotional attachment fueled the dot-com bubble and the 2007 housing crisis. In every case, the warning signs were present in the charts for those willing to look at them logically rather than through a lens of emotion and narrative.
The current environment is no different. Stocks like Nvidia, Palantir, and others have delivered incredible returns, but they are not immune to the laws of financial gravity. The goal of a trader is not to be a fan or a cheerleader, but to use these instruments to generate wealth. This requires the discipline to recognize when a beloved stock is overbought and potentially a short, and when a beaten-down name has reached a key support level and become a buy. This emotional flexibility is what separates consistent profitability from the boom-and-bust cycle that traps so many market participants.
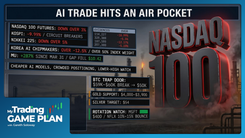
When Good News is Bad News: An Earnings Deep Dive
This earnings season is revealing a critical shift in market sentiment: valuation is starting to matter again. We are seeing a pattern where companies report strong earnings, yet their stocks fall anyway. Palantir had great earnings and sold off. AMD had good earnings and sold off. This phenomenon often occurs near market tops, when expectations are so high that even excellent results are not enough to justify nosebleed valuations.
Meta provided a key example of this sentiment shift. While not a chipmaker, their massive spending on AI chips from Nvidia caused investors to pause. When CEO Mark Zuckerberg announced plans to spend tens of billions more, the stock fell sharply. Investors are beginning to ask a crucial question: "are we just throwing money down into the Metaverse, which turned out to be nothing… is that what's going on now?" At some point, the promise of future growth must translate into tangible profits, and the market is becoming impatient.
This environment creates specific, actionable trade setups for disciplined technicians:
- AMD: After flushing as low as $235 post-earnings, the stock has bounced. That $235 level is no longer a prime entry, as the "first hit" is always the strongest. As Gareth explained using the "door theory," a level is strongest the first time it's tested. The more compelling level for a potential day trade now lies at the gap fill at $217.75.
- SMCI: This stock missed earnings estimates and is now trading below a critical multi-year support trendline. This is a classic breakdown setup. However, chasing the stock lower after a 20% drop is a low-probability trade. The professional approach is to wait for confirmation. "We got to see, does it close below? Does it confirm? Those are the telltale signals." If it confirms the breakdown, a downside move toward the $28.50 to $29.00 zone becomes highly probable.
- ANET (Arista Networks): Crushed on earnings, this ancillary AI play has multiple levels to watch. A higher-risk day trade level exists at the pivot lows and gap fill around $138.75. A more patient swing trader would be eyeing the support zone around $130, or the major gap fill even lower on the chart.
Bitcoin's Perfect Rejection and Macro Indicators
The principle of trusting the charts extends far beyond equities. Bitcoin provided a masterclass in technical precision, perfectly rejecting a monumental trendline that connects the 2017 bull market high, the 2021 high, and the recent peak. This was not a coincidence; it was the predictable outcome of price meeting a multi-year resistance level.
"The theme here is to trust the charts until proven otherwise," Gareth emphasized. The subsequent sell-off saw Bitcoin pierce the psychological $100,000 level and break a key two-year uptrend line that began in October 2023. While the crypto is getting a small bounce, the technical damage is significant, and the break of this long-term bull market trendline is a major red flag unless it can be decisively reclaimed.
Other key macro charts are also at important junctures:
- US Dollar (DXY): The dollar is strong but pushing into a major resistance zone after six consecutive up days. A "time count" suggests a pullback is likely imminent, possibly as soon as tomorrow.
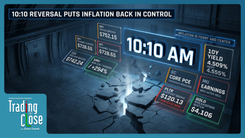
- 10-Year Treasury Yield: After surging last week, yields are consolidating sideways in what appears to be a classic bull flag pattern. A breakout from this pattern would target the 4.2% resistance level, which could add further pressure on equities.
- Gold & Silver: Gold is hovering at its first support level but appears poised to move lower toward a target of $3,875. Silver is forming a potential bear flag, which, if it breaks down, targets the $42 to $43 per ounce range.
Conclusion: Navigating the Danger Zone with Discipline
The evidence is mounting that the market has reached a critical inflection point. Overextended leadership in the semiconductor sector, bearish formations on the S&P 500, a shift in earnings season sentiment, and a breakdown in risk assets like Bitcoin all point to a period of heightened risk and potential correction.
This is not a time for fear, but for discipline, patience, and a steadfast reliance on logic and technical analysis. The "danger zone" is also a zone of immense opportunity for prepared traders who have identified key support levels in advance. By remaining emotionally detached, waiting for price to come to predefined levels, and respecting the historical precedents laid out in the charts, traders can confidently navigate the weeks ahead. The game plan is clear: trust the charts, manage risk, and be ready to act when high-probability setups present themselves.
Trading involves substantial risk. All content is for educational purposes only and should not be considered financial advice or recommendations to buy or sell any asset. Read full terms of service.