My Trading Game Plan Revealed - 12/02/2025: S&P 500 Five-Year Resistance, Apple Sell Alert, Bitcoin Top Warning

After a five-day rally during the low-volume Thanksgiving holiday week, institutional money returned to the markets with a vengeance, delivering the down day many traders were anticipating. However, the selling pressure was somewhat muted, and markets are already attempting to grind higher. In this morning's My Trading Game Plan, Gareth Soloway, Chief Market Strategist at Verified Investing, dissected the critical technical levels that could define the market's next major move and revealed a fascinating leading indicator that suggests a major top could be forming.
This article delves deeper into the powerful technical patterns at play, the psychological discipline required to navigate them, and the ominous historical precedent that Bitcoin may be setting for the S&P 500.
The S&P 500 vs. a Five-Year Wall of Resistance
The S&P 500 is currently testing a technical structure of immense significance. While short-term traders are focused on yesterday's highs as immediate resistance, the daily chart reveals a much larger battle unfolding. A massive parallel channel, drawn from the market extremes of the last five years, is now acting as a formidable ceiling.
Gareth emphasized the undeniable power of this structure: “Basically this parallel has marked every major market high and low for the last five years. I mean, think about that. A parallel channel that literally has predicted every high and low in the market over the last five years.”
This isn't just another trendline; it's a multi-year roadmap of institutional supply and demand. Each time the price has approached the upper or lower boundary of this channel, a major reversal has followed. For a technical analyst, ignoring such a consistent and powerful pattern would be reckless. The logical approach is to assume this level, just under 7000 on the S&P, is major resistance until the market proves otherwise with a decisive and confirmed breakout.
This disciplined perspective stands in stark contrast to the prevailing market narratives. As Gareth notes, it’s easy to get caught up in the hype. “Who am I to say, oh well we're going to blow right through it right up here, right? I have to, just nature of common sense and logic… just assume this is a major resistance and even this could be a major pivot top here until it is proven otherwise.” This approach isn't bearish or bullish; it's probabilistic. It acknowledges the historical weight of the evidence on the chart and positions accordingly.
The Casino Mentality: Logic Over Loud Narratives
The challenge of respecting a technical level like the S&P 500’s parallel channel is that it often requires ignoring a chorus of conflicting opinions. The financial media and social media are filled with bold predictions, often driven by emotion and narrative rather than data.
Gareth highlighted the recent predictions for Bitcoin as a prime example: “Bitcoin, I mean, think about the predictions on Bitcoin going into November, $250,000 by year end, right? And I just kind of scratched my head and said, okay, you know, like if that's the way they're going to view it, they're using emotion and hype to promote their target prices versus a technician which uses logic.”
This is the core philosophy that separates consistently profitable traders from the gambling crowd. A technician uses charts to determine probabilities. The goal is not to be right 100% of the time—an impossible feat—but to consistently place trades where the odds are stacked in your favor. Over hundreds of trades, this statistical edge is what generates profit.
“I'll never win 100% of the time, but at least using probability, essentially I become the casino versus the gambler,” Gareth explained. The casino doesn't win every hand, but its business model is built on a mathematical edge that guarantees profitability over the long run. Traders who adopt this mindset focus on high-probability setups, manage risk meticulously, and let their edge play out over time, free from the emotional swings of greed and fear.
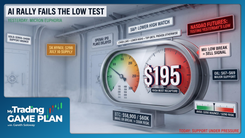
Apple’s Apex: A Textbook Test of Resistance
The principle of respecting major technical patterns is playing out perfectly on the chart of Apple (AAPL). The stock has been a recent recipient of money flow, rallying strongly as other tech giants like NVIDIA have pulled back. This rally has carried Apple directly into the upper boundary of its own massive parallel channel, one that stretches back to the COVID lows in 2020.
This setup is so clear that Gareth issued a major alert, stating, “Apple becomes a sell today. For me, based on this, I will likely be shorting Apple as a swing trade position, looking for a pullback after it tagged the upper range of this parallel.”
What makes the Apple story particularly instructive is the narrative shift that accompanied the rally. After underperforming for much of the year, sentiment suddenly turned positive. This was no accident. “Everyone was hating on Apple for a while. And then the narrative suddenly switches because institutional money has now positioned themselves long on Apple… But don't think that the narrative now won't flip back.”
This is a masterclass in how the market machine works. Narratives are often crafted to serve institutional positioning. By the time a positive story hits the mainstream media, the smart money is often preparing to sell into the retail buying frenzy they helped create. This is precisely why following charts, not headlines, is paramount. The chart of Apple provided an objective, data-driven sell signal right as the narrative reached its most bullish pitch.
The Global Yield Story: Why Japan Matters
While the major indices test their overhead resistance, a crucial driver of near-term market direction is unfolding in the global bond market. The 10-year yield in Japan has become a key focus. Yesterday, a sharp pop in Japanese yields corresponded with a sell-off in U.S. equities. Today, with Japanese yields flat, the market is finding room to breathe.
This highlights a critical concept: global capital is interconnected. A surge in Japanese yields can spook bond investors worldwide, causing them to demand higher rates and pushing U.S. yields up in sympathy. This is precisely what we’re seeing in the U.S. 10-year yield, which has been bouncing for three days despite an upcoming Federal Reserve meeting where a rate cut is expected.
This may seem counterintuitive, but it underscores a fundamental truth about markets that many investors miss. “Remember the Fed controls the short end of the curve, not the long end,” Gareth reminded viewers. The Fed can cut its policy rate, but if the global investors who buy U.S. debt demand a higher return for lending money over 10, 20, or 30 years, those long-term yields will rise regardless of the Fed's actions. The current rise in U.S. yields is likely a direct reflection of this global pressure, originating from Japan, rather than a reaction to domestic policy expectations.
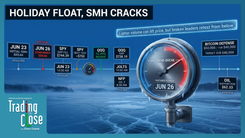
Bitcoin’s Warning: A Leading Indicator for Market Tops
Perhaps the most compelling piece of analysis from today's session was the examination of Bitcoin as a leading indicator for major stock market tops. By studying the last several market cycles, a fascinating and potentially predictive pattern emerges.
- 2017-2018: Bitcoin put in its bull market top on December 17, 2017. Approximately five weeks later, on January 26, 2018, the S&P 500 topped out and suffered a dramatic correction.
- 2021-2022: Bitcoin topped on November 10, 2021. About six weeks later, on January 4, 2022, the S&P 500 marked its bull market high before entering a prolonged bear market.
- 2025: Bitcoin topped on October 6, 2025. Just three weeks later, on October 29, the S&P 500 put in a high before a sharp decline.
The theme is consistent: a major top in Bitcoin, followed by a significant correction, tends to precede a top in the S&P 500 by approximately three to six weeks. The theory behind this is that de-risking begins in the most speculative, highest-risk assets first. As large pools of capital start to get nervous, they sell their crypto holdings before moving on to sell their stock portfolios.
“It tells us that Bitcoin is a great leading indicator potentially that we should pay attention to,” Gareth concluded. Given that Bitcoin has already fallen about 30% from its October high, this historical precedent suggests that the current level on the S&P 500 may not just be a temporary resistance point, but a major top that could lead to a much larger market correction.
Conclusion: Navigating an Uncertain Market
The market is at a critical juncture. The S&P 500 and key components like Apple are pressing up against powerful, multi-year resistance levels that have historically marked major turning points. At the same time, global bond markets are flashing warning signs, and the most reliable leading indicator of the last decade, Bitcoin, is suggesting that the top may already be in.
In this environment, discipline is paramount. The temptation to chase the market higher based on bullish narratives is strong, but the charts demand respect for the overhead supply. By focusing on probability, identifying multi-factor levels, and understanding the subtle clues from intermarket analysis, traders can position themselves to profit from whatever comes next. Whether this proves to be a momentary pause or the start of a significant correction, a logical, chart-based game plan remains the surest path to navigating the uncertainty ahead.
Trading involves substantial risk. All content is for educational purposes only and should not be considered financial advice or recommendations to buy or sell any asset. Read full terms of service.