My Trading Game Plan Revealed - 12/15/2025: Market Hits a Brick Wall, Mega-Cap Rotation, 10-Year Yield Pivot and High-Probability Trade Setups

After a significant sell-off on Friday, sparked by disappointing earnings from tech bellwethers and a sharp rise in Treasury yields, the market is attempting to find its footing. The session was a stark reminder of the fragility of the current rally and the underlying tensions between AI-driven hype and economic realities. In this morning's My Trading Game Plan, Gareth Soloway, Chief Market Strategist at Verified Investing, dissected the technical landscape, revealing a critical divergence between major indices, a potential cap on any year-end rally, and several high-probability trade setups for the coming weeks.
This article delves deeper into these key themes, providing historical context and expanded analysis on the market's most pressing questions. We'll explore the great rotation out of mega-cap tech, the precarious balance of the 10-year yield, and the specific chart patterns that could define trading into 2026.
The Santa Claus Rally Meets a Brick Wall
As we head into the latter half of December, talk of a "Santa Claus Rally" inevitably fills the air. Historically, markets do show a neutral-to-positive bias into the year's end. However, a disciplined, probability-based approach requires us to look beyond seasonal tendencies and analyze the hard data presented by the charts.
While a year-end float higher is possible, Gareth's analysis of the S&P 500 weekly chart reveals a formidable obstacle. A massive, multi-year trendline connecting the 2021 all-time high with the most recent peak looms directly overhead. This isn't just a line on a chart; it's a proven area of major supply where sellers have consistently overwhelmed buyers.
"We must look at what's before us and say, that's a brick wall. We can't assume that we're going to just blow right through it, especially when history has shown us it has been a stagnant point of reversal in the markets."
Based on Friday's closing price, the best-case scenario for a rally to tag this trendline offers a limited upside of approximately 2.35%. For traders, this presents a challenging risk/reward proposition. While a 2.35% gain is not insignificant, the risk of a sharp rejection from such a major resistance level is substantial. This technical ceiling suggests that any holiday cheer in the markets may be short-lived, forcing investors to prioritize capital preservation over chasing marginal new highs.
A Tale of Two Markets: The Great Rotation Accelerates
One of the most crucial dynamics currently at play is the growing divergence between the S&P 500 and the Nasdaq 100. While the S&P 500, a broad measure of 500 companies, is hovering just a couple of percentage points from its all-time high, the tech-heavy Nasdaq is in a demonstrably weaker technical position.
The Nasdaq 100 broke a key uptrend line and recently rallied back to test it from below—a classic technical maneuver known as a "retrace to the scene of the crime"—before being rejected. This weakness stems from the index's heavy concentration. As Gareth points out, "the NASDAQ 100 is 100 companies and literally 50 percent of that whole entire index is basically 10 stocks."
When we peel back the layers, the story becomes clear. The mega-cap darlings that drove the 2025 rally are faltering.
- Microsoft (MSFT): Well off its all-time highs.
- Meta (META): Significantly down from its peak.
- Amazon (AMZN): Trading well below its record high.
- Nvidia (NVDA): Also substantially off its all-time high.
Most of these former leaders are 10-15% below their highs, while the S&P 500 is only about 2% away. This isn't a sign of broad market weakness; it's a clear signal of capital rotation. Money is flowing out of the overvalued, over-owned mega-caps and into other sectors and stocks that have been left behind. This rotation is a key theme that savvy investors must understand to position themselves for 2026.
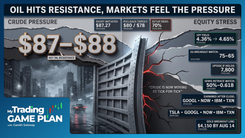
The "Porridge is Just Right" Scenario for Yields
The 10-year Treasury yield remains a central character in the market's story. On Friday, its sharp push higher contributed to the equity sell-off. Today, its modest pullback is helping stocks find a bid. The yield is currently stalled at a critical technical pivot point—a level that was major support for months has now flipped to become major resistance.
The market's relationship with yields is nuanced. It's not as simple as "lower is better." Gareth laid out three potential scenarios, likening them to the story of Goldilocks:
- Too Cold (Crash): A sudden, sharp collapse in yields would signal panic and a flight to safety, likely indicating the economy is spiraling into a major recession. In this case, stocks would fall hard as earnings expectations get crushed.
- Too Hot (Breakout): A breakout above the current resistance level would mean higher borrowing costs, which would suck liquidity out of the system and put significant pressure on stock valuations.
- Just Right (Slow Decline): A slow, orderly drift lower in yields into year-end would be the bull case. This would provide a tailwind for equities, allowing for a potential float higher into the major resistance on the S&P 500.
For now, the market is hoping the porridge is "just right." Traders must watch this level on the 10-year yield with vigilance, as its direction will likely dictate the market's path of least resistance.
High-Probability Setups for 2026
Amid the broader market crosscurrents, specific stocks are forming compelling technical patterns. Here are a few key setups Gareth is watching.
Broadcom (AVGO): A Strategic Entry Plan
After a significant post-earnings drop, Broadcom is approaching a key technical support level. A powerful trendline is converging in the $353 USD to $354 USD range. However, trading is more than just identifying a line. Gareth revealed his specific game plan, which accounts for market psychology:
"The way I'm going to trade this… is I'm going to nibble at around $353, $354, but only nibble. Why? Because in technical analysis, even numbers are very psychological. If we get as low as $353, $354, I've got to leave room to dollar cost average at $350."
This two-pronged approach is brilliant. It allows for an initial entry at the precise technical trendline while reserving capital to add at the psychologically significant $350 USD level, a common target for institutional stop-loss hunts or "flushes." This disciplined strategy increases the probability of catching the true bottom of the move.
Salesforce (CRM): A Bullish "Sleeper Play"
Tying into the theme of capital rotation, Salesforce presents a compelling bullish setup for early 2026. Unlike the mega-caps, CRM is still trading at levels it first reached in 2023, meaning it hasn't participated in the massive AI-fueled run.
The stock has just broken out of a multi-month wedge pattern and is now consolidating. Gareth is looking for this consolidation to hold above the breakout level, creating a bull flag. His target entry zone is between $255 USD and $257 USD. The risk is well-defined: a confirmed close below the psychological even number of $250 USD would negate the pattern, allowing for a quick exit with a manageable loss. This setup offers an attractive risk/reward for a potential large-cap outperformer in the new year.
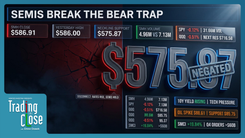
CrowdStrike (CRWD): A Classic Topping Pattern
On the bearish side, cybersecurity firm CrowdStrike is potentially forming a classic Head and Shoulders top. This pattern, which signals a potential trend reversal from up to down, would be confirmed by a break of the "neckline" support around the $480 USD level. If this level gives way, the measured move target points to a significant drop toward $405 USD.
Bitcoin's Bear Flag Decision Point
In the cryptocurrency space, Bitcoin continues to consolidate following its sharp decline. The price action has formed a textbook bear flag pattern—a period of choppy, sideways-to-upward movement after a large move down.
"Bear flags by definition are sideways to up chop… The key is it's a timing factor because eventually the bear flag breaks down. That looks exactly what we're doing here on the charts."
By their nature, these patterns are continuation patterns, meaning the odds favor an eventual breakdown and another leg lower. A break below the flag's lower boundary would likely send Bitcoin cascading toward the $80,000 USD level. Gareth's ultimate target buy zone remains the major support confluence between $69,000 USD (the 2021 high) and $74,000 USD. For this bearish pattern to be negated, Bitcoin would need to decisively break out and hold above the $100,000 USD psychological level.
Conclusion: Embracing Volatility for Profit
After a period of relative calm, Friday's sharp sell-off reintroduced a welcome ingredient for active traders: volatility. While many investors fear sharp market swings, professionals understand that volatility creates opportunity. A slow, grinding market offers few entry and exit points, but a volatile one provides numerous high-probability setups for both long and short positions.
As we navigate the final weeks of the year, the technical roadmap is becoming clearer. The market is contending with major overhead resistance, a significant rotation is underway beneath the surface, and key assets from Treasury yields to Bitcoin are at critical inflection points. By focusing on probabilities, adhering to well-defined technical levels, and maintaining a disciplined trading plan, investors can confidently navigate this dynamic environment and position themselves for a profitable start to 2026.
Trading involves substantial risk. All content is for educational purposes only and should not be considered financial advice or recommendations to buy or sell any asset. Read full terms of service.