Trading Game Plan Revealed - 10/02/2025: Markets at Generational Trendlines: S&P & Nasdaq Tests, Semiconductor Surge and Catch‑Up Trades

As the markets digest the end-of-quarter window dressing and the first-of-the-month money flows, a more realistic picture of investor sentiment is beginning to emerge. While the S&P 500 continues its slow grind higher, it is rapidly approaching a critical technical juncture that could define the market’s direction for weeks to come. In this morning's Trading Game Plan show, Gareth Soloway, Chief Market Strategist at Verified Investing, highlighted the monumental trendlines being tested on both the S&P and the Nasdaq, the deepening divide between market winners and losers, and the hidden opportunities emerging in some of the most beaten-down sectors.
The Moment of Truth at Generational Trendlines
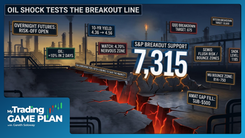
The market is currently defined by two critical trendlines on the major indices, each with its own significant history. For the S&P 500, the price action is converging within a massive wedge pattern, with the upper boundary now looming as formidable resistance. This trendline, currently sitting around the 6,745 level, is not just a random line on a chart; it has a storied past. It acted as solid support three separate times—in 2023, August of 2024, and January of 2025—each time catapulting the market higher. After breaking down during the "Liberation Day sell off," the index is now testing this same line from below, a classic technical scenario where prior support becomes new resistance.
"Will it tag the upper end of this trend line, which is sitting currently around 6,745, give or take a point."
While the S&P 500 still has a few points to climb before this crucial test, the tech-heavy Nasdaq 100 is already there. The QQQ has tagged its own upper trendline, a line that is arguably even more significant. As Gareth pointed out, "This trend line is even more impressive because it goes back to the COVID lows." This multi-year line, originating from the market bottom in 2020, has repeatedly marked major turning points. The question now is whether the market has the strength to power through these historical ceilings or if they will once again prove to be a point of rejection. The outcome of this battle will likely set the tone for the entire market.
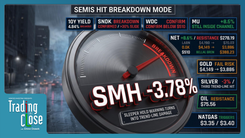
The Semiconductor Supernova and Narrowing Breadth
The primary engine behind the Nasdaq's recent strength has been the semiconductor sector, which has been on an absolute tear. The bullish sentiment is so powerful that it seems almost nothing can slow it down. Yesterday, news that Intel was likely to supply chips to AMD sent both stocks rallying. This created a fascinating dynamic where Taiwan Semiconductor (TSM), which stood to lose business from Intel, still managed to close up 3%. As Gareth aptly summarized, the prevailing mood is simply to "buy everything related to semiconductors."
This relentless buying has pushed names like Western Digital (WDC) and Seagate Technology (STX) into near-vertical ascents. While exhilarating, these parabolic moves introduce significant risk. Gareth used a powerful analogy to describe the situation: the rubber band effect. "You can stretch it, stretch it, stretch it, stretch it, stretch it, stretch it, stretch it. The more you stretch it, at some point, it snaps back harder… When it's a vertical move, the pullbacks are dramatic." This principle suggests that while it's impossible to know the exact top, the eventual correction in these high-flying names is likely to be as swift and severe as their ascent.
Even the sector titan, NVIDIA, is approaching a critical resistance line of its own around the $190.50 level. This trendline connects the 2021 bull market high with more recent peaks, making the $190 to $191 zone a major technical hurdle. A failure here could signal a pause in the semiconductor rally, while a decisive break above could open the door to prices well over $200.
A Tale of Two Markets: The Haves and the Have-Nots
Beneath the surface of the headline indices, a significant divergence is taking place. While the semiconductor sector soars, many other former market leaders are showing serious signs of technical damage. This bifurcation between the "haves" and the "have-nots" is creating a treacherous environment where the market's strength is becoming dangerously concentrated.
On the "have-not" side, the charts are telling a bearish story. Netflix is a prime example, having formed a textbook inverse cup-and-handle pattern—a bearish formation that suggests significantly lower prices ahead. As Gareth quizzed his viewers, "Are you aware that you can look at the inverse, right? Every pattern has an inverse pattern formation that can play out…" Similarly, Amazon has broken its uptrend and is now consolidating in a bear flag, while retail giant Costco has also broken down from its leadership perch. Even the cruise lines, like Royal Caribbean (RCL), which saw a spectacular run from $160 to $360, have broken down and are flagging bearishly.
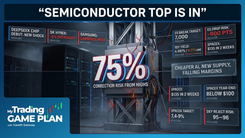
This growing list of broken charts, which also includes Meta with its head-and-shoulders breakdown, paints a picture of thinning market breadth. The rally is being carried by an increasingly narrow group of stocks, primarily in the semiconductor space. The entire semiconductor sector now boasts a market cap of over $10 trillion, with NVIDIA alone accounting for 14% of the Nasdaq 100. This level of concentration is a classic warning sign, often seen near major market tops.
Investor Psychology and the Economic Backdrop
The current market fervor is occurring against a backdrop of weakening economic data and extreme investor positioning. Yesterday's ADP private payrolls report came in at a negative 32,000 jobs, a concerning sign for the labor market. With the official non-farm payrolls report on hold due to a government shutdown, the ADP number takes on greater significance. Gareth noted the historical irony that after years of being dismissed, the ADP data has proven to be more accurate than the government's heavily revised numbers. "Going forward, I'm going to trust the ADP numbers more about the state of the economy."
This economic reality seems lost on many investors, who are now more leveraged and exposed to stocks than ever before. Margin debt is at all-time highs, and the retail investor is fully committed. This "all in" mentality is a stark contrast to the sentiment just before the COVID rally, and it carries historical echoes of previous market peaks. "Remember like in just before COVID the whole complaint was, oh, the retail investor is not even in this market. Oh, now they're in… Oh, now they're in, no doubt about it, which is usually when the rug gets pulled." This extreme bullishness, combined with the rise of commission-free trading platforms that encourage speculative behavior, creates a fragile environment susceptible to sharp reversals.
Hunting for Value: The Catch-Up Trade
While the high-flyers present significant risk, the market's bifurcation is also creating compelling opportunities in beaten-down sectors. Gareth identified what he believes might be the most important theme for investors right now: the "catch-up trade." Instead of chasing parabolic moves in stocks that are up hundreds of percent, the smarter play may be to look for value in quality companies that have been left behind.
Pfizer is a perfect case study. After forming a long-term base, the stock has exploded higher, driven by a new deal with the government. This powerful move demonstrates that capital is beginning to rotate into undervalued areas. Other potential candidates for this catch-up trade include:
- Chipotle (CMG): The stock has been beaten down to levels not seen since 2021 and is now sitting right on major technical support.
- Keurig Dr. Pepper (KDP): After a vertical drop, the stock is testing a confluence of trendline support and pays a healthy 7% dividend while you wait for a potential rebound.
- UPS: This logistics giant has fallen from a high of $230 down to just $80, landing squarely on a critical long-term support level, and it also pays a dividend.
These examples highlight a key strategic approach: in a market with extreme valuations in one corner and deep value in another, there are opportunities for both long and short positions. The key is to identify where the risk/reward is most favorable.
Critical Levels Across Crypto and Commodities
The major technical tests are not confined to the equity markets. Bitcoin is currently at what Gareth described as a monumental level. "This, my friends, is so big right now. It is such a big level on Bitcoin." The cryptocurrency is testing the $118,000 area. Historically, every time Bitcoin has closed and confirmed a break above this level, it has gone on to make a new all-time high. A successful hold and confirmation here could signal the next major leg up.
Meanwhile, Ethereum is facing a test of its own, pushing up against the underside of its former support trendline, now acting as resistance around the $4,450 to $4,500 zone. This is a crucial area that ETH must reclaim to continue its bullish momentum.
In precious metals, silver has successfully reached the lower end of Gareth's long-standing target zone of $48 to $50. Having pierced $48, the 1980 low, the magnetic pull of the $50 level, the 2011 low, remains strong. While a short-term pullback is possible, especially as it approaches trendline resistance just above $50, the overall bull market trend appears intact.
Conclusion: Navigating an Inflection Point
The market stands at a critical inflection point. The S&P 500 and Nasdaq 100 are testing multi-year trendlines that have historically marked major turning points. At the same time, the underlying health of the market is being questioned as a handful of semiconductor giants carry the indices higher while a growing number of former leaders break down. This environment demands vigilance and a nuanced approach. While the temptation to chase the high-flyers is strong, the greater opportunity may lie in the unloved, beaten-down sectors that are just beginning to show signs of life. By paying close attention to these key technical levels and the widening divergence within the market, traders can better position themselves for the volatility and opportunity that lies ahead.
Trading involves substantial risk. All content is for educational purposes only and should not be considered financial advice or recommendations to buy or sell any asset. Read full terms of service.