Trading The Close Market Recap - 01/29/2026: Volatility Surge — S&P Wicks, Bitcoin 'Death Cross' Warning & Breakout-Retrace Opportunities

The financial markets delivered a masterclass in volatility today, presenting a landscape defined by sharp intraday reversals, critical technical tests, and a stark divergence between winning and losing sectors. From the massive wicks on the major indices to a potential long-term warning signal flashing in the cryptocurrency markets, traders were forced to navigate a minefield of price action.
In this afternoon’s Trading The Close show, Pro Trader Drew Dosek at Verified Investing broke down the chaotic session, revealing the "story of the halves and have-nots" and issuing a significant warning for Bitcoin investors based on historical cycle analysis.
The Tale of the Wicks: S&P 500 and Nasdaq Resilience
The defining characteristic of today’s session was the "wick." In technical analysis, a long lower wick on a candle often indicates that bears attempted to push prices lower, but bulls stepped in with overwhelming force to reclaim lost ground by the close.
The S&P 500 exemplified this battle. After opening strong, the index plunged, piercing significant support levels before staging a dramatic recovery in the final 30 minutes of trading. The index finished down just 0.21%, a remarkable feat given the intraday selling pressure.
Pro Trader Drew highlighted the critical nature of this recovery on the intraday charts:
"Look at all of that selling pressure that took place right at the beginning of the day. And then when price did bounce up, where did it stop, folks? Right here on the top of our parallel channel on the 10-minute chart… The S&P 500 did test this parallel and is remaining above it and staying above near-term. That's actually very positive for the markets."
Had the S&P 500 closed back inside its parallel channel after such a significant pierce, it would have constituted a "mortal wound" for the bullish case. Instead, the market’s resiliency—which Drew noted "literally leaves me lost for words"—kept the technical structure intact.
The Nasdaq (Q's) told a similar story, dropping 0.6% but closing well off its lows. While the ETF did close outside of its parallel channel, the presence of a massive test candle suggests that confirmation is still needed. Bears would need to see a close below today’s long wick to confirm a breakdown, otherwise, this may simply be a retest before continuation.
The Bitcoin Cycle Warning: A History of 60% Declines
While the equity markets showed resilience, the most alarming signal of the day emerged from the cryptocurrency sector. Bitcoin dropped 5%, breaking an inclining trendline and closing below near-term support. However, the immediate price action pales in comparison to the structural warning developing on the weekly timeframe.
Pro Trader Drew unveiled deep research into Bitcoin’s historical market cycles, specifically focusing on the relationship between the 20-period and 50-period simple moving averages (SMAs) on the weekly chart.
"I've been talking to you guys about this and saying, guys, there's something I want to show you. Well, today is the day I'm going to show you. This may not be done with Bitcoin selling pressure. We may be due for a long-term correction in Bitcoin."
The "Death Cross" Precedent
The analysis focused on what happens when the 20-week SMA crosses below the 50-week SMA. The historical data presents a sobering probability for crypto bulls:
- 2014 Cycle: Following the cross, Bitcoin declined 63%, and the moving averages did not correct back to a bullish alignment for 343 days.
- 2018 Cycle: The cross resulted in a 62.87% decline, with the bearish trend persisting for 161 days.
- 2021/2022 Cycle: The cross preceded a decline of over 60%, taking more than a year (over 500 days) for the 20 SMA to recover above the 50 SMA.
Currently, this exact crossover event is occurring again. If history repeats—and markets are essentially engines of human psychology repeating itself—the implications are severe. A 60% decline from recent highs would target a price under $40,000.
"That 50 [SMA], as long as it's staying above that 20 moving average on the weekly time frame. Guys, watch out… We could be under a full another year of downside in Bitcoin as well as altcoins."
While near-term bounces are expected at the 200-week moving average and the $50,000 psychological level, the macro trend suggests a "shotgun approach" to accumulation at much lower levels may be the prudent strategy for long-term investors.
The "Breakout Retrace": A Swing Trader’s Goldmine
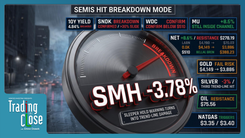
Amidst the volatility, a classic and highly profitable technical pattern emerged in the semiconductor and small-cap sectors: the "Breakout Retrace."
The SMH (Semiconductor ETF) and IWM (Russell 2000 ETF) both exhibited this setup. The pattern occurs when an asset breaks out above a resistance trendline, rallies, and then pulls back to test that same trendline—which now acts as support—before accelerating higher.
On the SMH, the ETF not only held the top 50% of its parallel channel but perfectly retested the breakout trendline before bouncing.
"If you can identify these on the charts, guys, these are major money makers that I have found for swing trading… Man, I just over and over and over again, they repeat on the chart."
Similarly, the IWM retested a trendline connecting pivots from November and December 2024. It bounced precisely off this level to finish above support at $262.48. While the IWM shows an "immature bear flag" that warrants caution, the successful defense of the breakout level offers a near-term bullish signal.
Precious Metals: Indecision at All-Time Highs
Gold and Silver experienced wild sessions, with Gold touching new all-time highs near $5,600 before reversing sharply to close down 0.44%. The resulting candlestick on the daily chart is a "Doji"—a formation with long wicks in both directions and a narrow body, signaling extreme indecision and a potential tug-of-war between buyers and sellers.
The intraday action on Gold was signaled by a "Three-Tail Theory" setup on the 10-minute chart—a series of wicks that implied a rip higher was imminent. That rip occurred, driving price from $5,150 to $5,400, but the subsequent fade suggests the metal may need to consolidate.
Silver mirrored this action, making new highs but closing with a Doji. It remains in a precarious position, needing a close above $117.73 to clear the woods. Downside support sits at $89.38.
The Software vs. AI Divergence: Microsoft and ServiceNow
Earnings season continues to highlight a major rotation within the technology sector. Investors are increasingly favoring pure-play AI hardware and infrastructure over traditional software companies, even when those software giants post solid numbers.
Microsoft: The $400 Vulnerability
Microsoft reported strong earnings, beating EPS by 6% and revenue by 1.2%. Yet, the stock plummeted nearly 11% intraday before a late-day recovery.
"It is certainly a story of the halves and halves not… There's a lot of hesitancy now in the marketplace where software companies are getting beaten up because AI is really stealing the thunder."
Technically, Microsoft found support at $425.26, but the damage to the chart is significant. The stock is now trading in the lower 50% of its parallel channel. If selling pressure resumes, the stock is vulnerable to a test of the $400 psychological level, which aligns with the bottom of the channel and pivots dating back to April 2024.
ServiceNow: A Monthly Trendline Opportunity
ServiceNow (NOW) suffered a similar fate, dropping nearly 10% despite beating earnings and guidance. The market’s reaction suggests that "good" is no longer "good enough" for software valuations.
However, this selloff is bringing ServiceNow closer to a massive opportunity on the monthly timeframe. A long-term trendline, tested five or six times previously, sits near $103.
"This is definitely oversold near term. A great bounce play could be had down here near the $100 level and a bounce that can take price all the way back up to this $136 resistance pivot."
Commodities and Industrial Flows
US Oil: Breakout Confirmed
US Oil staged a 2.79% rally, confirming a breakout. The price action suggests that any pullbacks to the trendline near $62.32 should be viewed as buying opportunities, with a target at the $68.94 resistance level.
First Solar: Headline Risk meets Technical Support
First Solar came under pressure following rumors that Tesla may enter the solar panel space—a classic "headline risk" scenario where a behemoth threatens a smaller player's market share. Despite the fear, First Solar respected technical support, bouncing off an inclining trendline connecting April and June lows.
If this trendline breaks, traders should watch $202.54 and $182.85 as potential bounce levels. Conversely, if the Tesla narrative fades, resistance lies at $250.
Lockheed Martin: Overbought but Strong
Lockheed Martin surged despite a mixed earnings report (missing EPS but beating revenue). The stock is now technically overbought with a daily RSI near 79. While the momentum is strong, the stock is approaching the top of a multi-year parallel channel dating back to COVID lows. Resistance is formidable at $650, while support lies significantly lower at $590.08.
Conclusion: Navigating the Degrees of Risk
Today’s market action reinforced the necessity of technical precision. Whether it was the S&P 500 holding channel support by a thread, Bitcoin flashing a historical warning signal, or software stocks being punished despite earnings beats, the charts provided the roadmap that headlines could not.
The divergence between the "halves and have-nots" is widening. While opportunities exist in breakout retrace patterns (SMH, IWM) and potential commodity bounces, the looming "death cross" on Bitcoin’s weekly chart serves as a reminder that cycles often dictate market direction regardless of near-term sentiment.
As Pro Trader Drew concluded regarding the crypto outlook: "Sometimes you buy at the right time, but if you're guided with TA, at least you can minimize some of those errors and then start buying at an intelligent and educated level on the charts."
In this environment of heightened volatility, patience and adherence to key technical levels remain the trader's best defense—and greatest edge.
Trading involves substantial risk. All content is for educational purposes only and should not be considered financial advice or recommendations to buy or sell any asset. Read full terms of service.