Trading The Close Market Recap - 03/24/2026: S&P Bounce Setup Amid 10-Year Yield Pressure, Energy Exhaustion & Tech Selloff

The financial markets are a complex ecosystem where macroeconomic data, geopolitical headlines, and technical price action constantly collide. Today’s session was a perfect example of this dynamic, characterized by intraday volatility, fluctuating oil news, and a tug-of-war between equity bulls and bond market bears. While the broader markets finished the day slightly in the red, robust after-hours movement suggests that underlying technical forces are actively at play.
In this afternoon's Trading The Close Market, Pro Trader Drew Dosek at VerifiedInvesting.com provided a masterclass on navigating these choppy waters. From dissecting the anatomy of true bottoming tails to identifying exhaustion in the energy sector, today’s analysis offered a roadmap for traders looking to capitalize on high-probability setups. Let's dive deeper into the technical frameworks and historical contexts behind today's most critical market moves.
The S&P 500's Technical Tug-of-War
The S&P 500 currently finds itself at a fascinating technical juncture. Despite a 0.34% decline during the regular session, the index managed to hold a critical line in the sand, finding firm support at 646.85 on the SPY ETF. This resilience was immediately rewarded in post-market trading, with the index pushing up nicely to 656.67.
From a structural standpoint, the market is heavily signaling that a near-term bounce is imminent. When analyzing the weekly timeframe, a distinct "W" pattern has emerged. More importantly, the 50-period weekly moving average recently kissed support and triggered a bounce. Drew Dosek highlighted the psychological and technical significance of this specific moving average behavior:
"…whenever we have a situation like this, where price is consolidating on top of other moving averages and moves within a decent distance down to tag the very next moving average, we generally see a bounce up."
Historically, moving averages act as dynamic zones of supply and demand. When an index compresses between these key levels, it acts like a coiled spring. The technical targets for this anticipated bounce are highly specific: a minimum push to 665.01, with an ideal target testing the daily 20 moving average at 662.56.
However, if the market fails to materialize this bounce and remains suppressed beneath its 200-day moving average, the bearish alternative becomes a drop to the 50% area of the parallel channel at 618.92. The primary culprit preventing this bullish release? The bond market.
The 10-Year Yield: The Ultimate Headwind
You cannot accurately analyze the current equity landscape without keeping a close eye on the 10-year Treasury yield. The yield remains stubbornly elevated at 4.35%, acting as a wet blanket on risk assets. High yields increase borrowing costs for corporations and offer a risk-free alternative to equities, naturally suppressing stock market valuations.
Despite a sharp drop in the final 10 minutes of the trading day, the yield is still hovering in a dangerous zone, with the potential to push higher toward 4.5%. However, technical analysis provides a glimmer of hope for equity bulls in the form of candlestick anatomy—specifically, the development of large wicks.
"Anytime you get repetitive large wicks on any chart… that is generally implying that price should be moving down lower on that chart."
A wick (or tail) on a candlestick represents intraday price rejection. When the 10-year yield repeatedly forms large upper wicks, it tells us a psychological story: bond bears are attempting to push yields higher during the session, but by the close, buyers step in, forcing the yield back down. If this pattern of rejection continues, it could serve as a leading indicator that yields are preparing to roll over, which would provide the exact catalyst the S&P 500 needs to execute its technical bounce.
Sector Divergence: Semiconductors vs. Small Caps
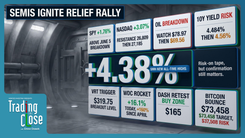
The divergence between different market sectors right now is stark, offering a clear view into institutional money flow. The SMH (Semiconductor ETF), long considered a vital leading indicator for the broader market, is flashing warning signs. While it has maintained near-term bullish consolidation within an inclining parallel channel, the weekly timeframe reveals a massive weekly topping tail.
A weekly topping tail is a historically potent bearish signal. It indicates that over the course of an entire week, buyers exhausted themselves pushing prices to new highs, only to be completely overwhelmed by sellers. If the SMH breaks its parallel channel support at $394.30, the probabilities heavily favor a decline to $371.50, followed by $358.17. Any near-term bounces should face stiff resistance around $407.40.
Conversely, the IWM (Russell 2000) is painting a different picture. Despite the pressure from the 10-year yield—which traditionally hurts debt-reliant small caps the most—the IWM closed up 0.54%. Why? Because it had already completed its measured move target to the downside. Technical buyers recognized that the bearish sequence was finished and began accumulating shares. As noted in the show, traders should be watching resistance at $250.25 after hours, and if momentum continues, the next resistance levels to contend with sit at $259.65.
The Anatomy of a True Bottoming Tail
One of the most valuable educational moments from today’s recap centered around precious metals, specifically Gold. Gold experienced a violent intraday plunge, piercing through targeted support around $4,400 before rocketing back up to leave a massive lower wick. While many retail traders immediately labeled this a "daily bottoming tail," Drew clarified why this terminology is technically incorrect:
"The daily bottoming tail, you need to have at least from this point, and even the low point, you need to have somewhere around 180 days of no prior price action here at very minimum…"
This distinction is critical for trading psychology and risk management. A true bottoming tail is a generational or multi-month rejection of a brand-new low. It requires a vacuum of historical price action (ideally 180 days) so that the rejection stands alone as a definitive statement by the market. Because Gold’s recent wick occurred within a cluster of recent price action, it lacks the absolute reversal power of a true bottoming tail.
Nevertheless, Gold is successfully defending support at $4,185.30. If the metal can consolidate and push higher, it faces resistance at $4,603, with a longer-term parallel channel target near $5,000. Silver is exhibiting similar behavior, tagging key support without closing beneath its low pivot. While a near-term bounce to $75.33 or $84.18 is possible, the broader bearish consolidation suggests Silver could eventually test the 50% parallel area around $58.
Energy Sector Extremes: Exhaustion Meets Precision
The energy sector provided a masterclass in both technical precision and momentum exhaustion today. US Oil traded relatively flat, printing a doji candle that signifies deep market indecision. However, the final 10 minutes of the session delivered a breathtaking technical moment. Oil prices plummeted from intraday highs of $93.40, perfectly tagging a major support level at $86.46 before immediately bouncing.
This level of precision is why professional traders rely on charting. The market is not random; it operates level-to-level. If oil tests this $86.46 support too many times, the floor will eventually give way, opening the door for a drop to $79.77—a move that would likely act as a massive tailwind for the S&P 500. Meanwhile, Natural Gas continues its search for a bottom, with a firm downside target still sitting at $2.71.
While the underlying commodity chops sideways, energy equities are flashing extreme overbought signals. Exxon Mobil (XOM) and Conoco Phillips (COP) have been on historic tears. COP has marched up relentlessly since its November 2025 pivot low, but today it slammed directly into a declining trendline dating back to October 2022.
The weekly Relative Strength Index (RSI) for these energy giants tells a story of total exhaustion. COP’s weekly RSI sits at a blistering 80.32, while XOM is even hotter at 83.66. Furthermore, XOM is printing new price highs without corresponding new highs in the RSI—a classic bearish divergence.
When stocks become this extended, they create massive "air pockets" underneath their current prices. Should any geopolitical resolution occur in the Middle East, the downside velocity on these names could be severe. XOM has downside support targets at $155.87 and $148.68, while COP faces a gauntlet of resistance at $135.31 and $138.38, with downside support resting at $120.50 and $113.85.
Mega-Cap Tech Breakdowns and Defensive Rotations
The foundational pillars of the stock market are beginning to show structural cracks. Google (GOOGL) suffered a significant technical failure today, breaking below the 50% area of its parallel channel and closing underneath a critical March 9th green candle. This breakdown exposes the stock to lower support levels at $279.07 and $269.36, though a retest bounce to $294.08 remains a possibility.
Microsoft (MSFT) paints an even bleaker picture. The software giant is now down over 32% since October, a staggering decline for a company of its magnitude. It is currently threatening to confirm a breakdown underneath its parallel channel. While near-term oversold conditions could spark a technical bounce back to $403.46, any failure to hold current support at $368.81 opens the trapdoor down to a major double-bottom pivot low at $345.
With mega-cap tech faltering and the broader market facing yield headwinds, professional money often rotates into defensive postures. General Mills (GIS) presents one of the most compelling, albeit beaten-down, setups on the board. The stock has collapsed from 2023 highs around $90 and is currently carving out a massive weekly head and shoulders pattern.
The measured move for this bearish pattern targets $30.26. However, with the weekly RSI sitting at a deeply oversold 24.88 and the daily RSI at 20.61, the stock is coiled for a violent mean-reversion bounce. Pro Trader Drew outlined a highly disciplined scaling strategy for this exact scenario: initiating a starter position at $36.42, adding 10% lower, and completing the position if the $30.26 measured move is tagged. The ultimate target for this defensive bounce play sits at the prior pivot breakdown near $43.20.
Cryptocurrency and Mineral Explorations
Rounding out the market landscape, Bitcoin experienced a slight down day, suffering a failed breakout attempt that temporarily stalls its near-term bullish momentum. To regain control, Bitcoin must push back above its immediate resistance line to target $80,800, followed by a major trendline between $84,000 and $85,000. Despite these near-term levels, the broader macro expectation remains that Bitcoin will eventually tag a sub-$50,000 target by this summer.
In the highly speculative mineral exploration space, technicals still reign supreme. TMQ, a Canadian copper exploration company, printed a nasty weekly topping tail and is plunging toward a critical June 2019 high pivot. If it can catch support here, a bounce to $3.87 is in the cards; if it fails, the trapdoor opens to $2.35. Conversely, deep-sea exploration company TMC is technically ripe for a bounce. After breaking a long-term trendline, probabilities favor a retracement bounce to test resistance at $5.46 before any further downside to the $3.20 support level materializes.
Conclusion: The Edge of Probability
Today’s market action perfectly encapsulates why emotional trading destroys capital, while probability-based technical analysis preserves and grows it. Whether it is identifying the exhaustion in Exxon Mobil, recognizing the difference between a true bottoming tail and intraday noise in Gold, or patiently waiting for General Mills to hit a measured move target, success in these markets requires an unwavering commitment to the charts.
"The longer we hang out sideways here, folks, that tells me we're going to break the bottom end of this parallel…"
This quote regarding the NASDAQ—which is currently chopping sideways and threatening a drop to 22,499—serves as a reminder for the entire market. Sideways consolidation at the bottom of a range is rarely bullish. As we navigate the remainder of the week, traders must keep a close eye on the 10-year yield's wicks, the S&P 500's moving average compression, and the critical support levels across mega-cap tech. By stripping away the noise and focusing purely on the data, investors can position themselves on the right side of probability, no matter which way the broader market decides to break.
Trading involves substantial risk. All content is for educational purposes only and should not be considered financial advice or recommendations to buy or sell any asset. Read full terms of service.