Trading The Close Market Recap - 04/20/2026: Options-Expiry Rally Pushes Markets to Multi-Year Resistance — Pullback Risk Looms

The financial markets have just emerged from a remarkably volatile options expiration week, leaving traders to navigate a landscape where major indices have been sent rocketing into the upper echelons of their historical resistance zones. As the dust settles, the critical question becomes whether this vertical momentum is sustainable or if the market is setting a trap for overly eager buyers.
In this afternoon's Trading The Close, Pro Trader Drew Dosik at Verified Investing dissected the mechanics behind last week's surge, revealing a confluence of overbought signals, historical parallels, and precise technical levels that demand immediate attention. Today's article expands on these critical themes, providing the depth and context necessary to navigate what could be a major inflection point in the markets.
The Options Expiration Hangover
To understand the current market positioning, we must first understand the mechanical forces that drove last week's aggressive rally. While the S&P 500 closed down a modest 0.2% today, the preceding Friday surge pushed the index directly into the top end of a massive parallel channel that has been intact since October 2022.
Many retail investors mistake these sudden, vertical rallies for fundamental economic strength, but professional traders recognize the underlying plumbing of the market at work. As Drew explained regarding the recent price action:
"It's a game, folks. Price action likely had been shorted all through this range. And when institutions and retail started covering those shorts, we shot the market straight up. All the while, all the puts that were bought in this range expired worthless."
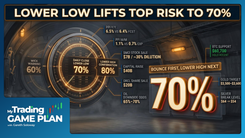
This phenomenon—a short-covering rally combined with the expiration of put options—creates a mechanical bid in the market that forces prices higher, regardless of macroeconomic data. However, these mechanically driven rallies often lead to severe overbought conditions. The NASDAQ, for instance, broke out of its near-term blue parallel channel last week only to run straight into a critical inclining yellow resistance trend line. With the options expiration fuel now spent, the NASDAQ is highly susceptible to consolidation or a decline back down to the top of its parallel channel at 26,128 points.
The 2022 Historical Parallel: A Cautionary Tale
One of the most compelling segments of today's analysis involved a direct historical comparison between current S&P 500 price action and the market environment of early 2022. Understanding historical fractals—patterns that repeat across different timeframes—is a cornerstone of elite technical analysis.
In February 2022, the onset of the Ukraine-Russia conflict triggered significant market volatility. By mid-March of that year, rumors of a ceasefire sparked a massive relief rally, pushing the S&P 500 up over 10%. However, that rally proved to be a bull trap, immediately followed by a devastating 20% plummet.
Today, we find ourselves in an eerily similar technical setup. The current market has rallied 12.65%, pushing to new all-time highs under similar geopolitical tensions. By jamming itself into the absolute top of a multi-year parallel channel, the S&P 500 is displaying the exact exhaustion characteristics seen before previous major market corrections. If this historical parallel plays out, the downside risk is substantial, with Pro Trader Drew identifying a previous major move target down at 20,500 points.
Dow Transports: The Ultimate Leading Indicator
Adding immense weight to the bearish thesis is the Dow Jones Transportation Index. In traditional Dow Theory, the transportation sector is viewed as a leading indicator for the broader economy; goods must be shipped before they can be sold.
Currently, the Dow Transports have accelerated up to 23,322 points, pushing the daily RSI to an extreme overbought reading of 83.31. But the most alarming technical factor is the weekly timeframe. The index has bubbled up against the top end of a massive inclining parallel channel that dates all the way back to 2010.
When an index hits the resistance line of a 14-year pattern, the probability of a rejection is exceptionally high. We saw a similar rejection at the top of this exact channel in 2021. When leading indicators like the Transports hit multi-decade resistance simultaneously with the S&P 500 and NASDAQ hitting their own resistance levels, professional traders immediately tighten their risk management.
Sector Divergence: Small Caps and Semiconductors
While the broader indices flashed warning signs, sector divergence provided nuanced trading opportunities. The Russell 2000 (IWM) was the lone major index to push higher today, up 0.57%. This relative strength was catalyzed by a slight pullback in the 10-year Treasury yield. The IWM has successfully executed a head and shoulders measured move, rocketed back up, and spent two days above its inclining neckline. To confirm this bullish momentum, traders need to see a high close on Friday above $277.63, which would flip previous resistance into support. Should it fail, minor support rests at $268.44.
Conversely, the semiconductor sector (SMH) illustrates the dangers of chasing extended momentum. The SMH gapped up over an inclining trend line, showcasing the undeniable strength of the AI narrative. However, the daily RSI has reached 75. As Drew noted, any RSI reading over 70 acts as a critical warning sign:
"It doesn't necessarily mean exactly when it hits 70… Price is going to retreat, but it is a warning sign, much like a warning track in baseball. We're getting into that warning track right now."
Rather than buying at the top of the warning track, disciplined traders will wait for a pullback to the first area of support at the 50% area of the parallel channel, located at $449.16.
The Psychology of Index Rebalancing: TEAM and SNDK
The individual stock setups discussed today highlighted the profound impact of index rebalancing on price action. The announcement that SNDK would be replacing TEAM in the NASDAQ triggered massive, forced institutional volume.
SNDK experienced a huge rally on the news, running straight into a gap fill. If momentum continues, it faces a formidable top-end parallel resistance at $1,063—a level that could offer a high-probability shorting opportunity for traders looking to fade the overextended news reaction.
On the other side of the trade, TEAM suffered a brutal plunge due to forced institutional selling. However, this exodus has created a compelling value proposition. The stock is currently staging a near-term V-shaped recovery, up 6.78% today. It successfully tested a long-term horizontal support trend line at $53.45. If TEAM can maintain traction, it has a clear path to attack the $97.54 level, followed by a key pivot at $115. Should the $53.45 level break, the next major support lies just under $40. This setup perfectly illustrates how traders can capitalize on the emotional and mechanical overreactions caused by index reshuffling.
Commodities: Technical Perfection in Oil and Metals
The commodities market continues to respect technical levels with astonishing precision, particularly in the energy sector amidst ongoing geopolitical tensions involving Iran.
U.S. Oil provided a textbook example of level-to-level trading. After plunging on Friday, price action tagged a pre-defined support level at $79.77—a level identified weeks in advance. It has since bounced, consolidating above minor support at $86.46. If the bullish momentum builds, oil faces a gauntlet of resistance levels: first at $91.05, then $95.25, and finally a key Fibonacci retracement level at $97.32. Conversely, any de-escalation in the Strait of Hormuz could send oil tumbling to support at $75.07, followed by $70.77.
Natural Gas (nat gas) closed up a marginal 0.18% today but failed to maintain momentum above a critical resistance trend line originating from April 1st. The absolute line in the sand for bulls is $2.825. A failure to close above this level keeps the probabilities weighted toward the downside, with support targets at $2.71 and $2.41. Minor resistance sits above at $2.9068.
In the precious metals complex, Silver is currently outperforming Gold. Silver is putting in strong bullish consolidation, eyeing next resistance at $84.18, followed by the top of its parallel channel at $88.00. Gold, while remaining strong, needs to break out of its own consolidation to attack its next resistance target at $5,077.
Cryptocurrency: Bitcoin's Critical Juncture
Bitcoin continues to test the nerves of crypto traders, having pulled back to a key support line before bouncing to $76,285 today. As long as price maintains above this trend line, the near-term probabilities favor a push higher toward $80,700, followed by an inclining trend line just over $85,000.
However, the longer-term macroeconomic picture remains precarious. Drew maintains a longer-term bearish outlook on Bitcoin, citing a massive head and shoulders pattern that carries a measured move target of sub $50,000. This bearish thesis would only be invalidated if Bitcoin can aggressively reclaim the $85,000 level.
The Discipline of the Retrace Bounce
Perhaps the most valuable lesson from today's market recap was the emphasis on patience and the mechanics of the "retrace bounce" play, specifically highlighted in the analysis of Tesla (TSLA), Apple (AAPL), Marvel (MRVL), and Global Foundries (GFS).
When a stock breaks out on news—such as MRVL exploding on reports that Google is eyeing them to develop AI chips—retail traders inevitably suffer from FOMO (Fear Of Missing Out) and chase the price higher. Professional traders do the exact opposite.
Despite MRVL entering breakout mode and targeting $165 by Tuesday, April 28th, the correct play is to wait for the RSI to cool down and for price to pull back to the inclining yellow trend line at $121.63. Similarly, while GFS broke a declining trend line dating back to March 2022 and faces next resistance at $60.50, its RSI of 77.98 demands patience. The high-probability entry is waiting for a pullback to the top of previous consolidation just above $50.00.
Tesla perfectly illustrates the beauty of this setup. After breaking out of a declining parallel channel on Friday, the stock retreated today. This retreat is not a failure; it is an opportunity. A pullback to the $380 level offers a high-reward entry for a bounce to $426.26. Why is this the preferred method? Because the risk is strictly defined. If TSLA closes below the declining trend line, the trader simply stops out for a minimal loss.
Apple, on the other hand, shows why context matters. While AAPL closed above its declining trend line, its bull flag measured move was already accomplished today, and its RSI is too close to overbought. Recognizing when not to take a breakout trade is just as important as knowing when to pull the trigger.
Conclusion: Clarity Before Complexity
As we navigate a market environment characterized by overextended indices hitting multi-year resistance, the difference between success and failure comes down to structure, discipline, and emotional control. The market is currently testing the upper bounds of historical channels across the S&P 500, NASDAQ, and Dow Transports. Whether we see a healthy consolidation or a violent 2022-style rejection remains to be seen, but the technical levels are clearly defined.
Trading is not about reacting to headlines, guessing market direction, or chasing green candles. It is a highly structured skill based on probabilities. This philosophy is the cornerstone of Verified Investing's newly released course, The Trader's Core. Built for beginner to intermediate traders, it focuses on "clarity before complexity, structure before speculation."
By learning to read the charts, identify high-probability patterns, and wait patiently for price to come to your predefined levels—whether that's oil at $79.77 or a Tesla pullback to $380—traders can strip the emotion out of their decision-making process. The market will always provide opportunities; the key is having the technical foundation to recognize them and the discipline to execute them flawlessly.
Trading involves substantial risk. All content is for educational purposes only and should not be considered financial advice or recommendations to buy or sell any asset. Read full terms of service.