Trading The Close Market Recap - 05/04/2026: Markets Pause as 10-Year Nears 4.5% — Bitcoin Breakout, Gold & Oil Key Levels

The market environment is currently a masterclass in mixed signals, subtle technical shifts, and sector-specific volatility. While the broader indices took a slight breather today, the underlying currents in commodities, cryptocurrencies, and individual equities are painting a complex picture. In this afternoon's Trading The Close, Pro Trader Drew Dosek at VerifiedInvesting.com broke down the critical levels, emerging patterns, and macroeconomic headwinds that traders must navigate as we push deeper into a highly active earnings season.
This article expands on the key themes from today's show, offering deeper historical context, psychological insights, and technical analysis to help you position your portfolio with precision.
Equities Take a Breather: The Anatomy of a Topping Tail
After an extended period of relentless green across the indices, the markets finally experienced a down day. However, context is everything. The S&P 500 pulled back a mere 0.41%, a fractional decline that hardly signals panic but warrants close technical attention.
The clue to today's downward price action actually revealed itself before the weekend. As Drew pointed out:
"We did register a daily topping tail on the S&P 500 on Friday. We did get follow-through today that did push us down. However, again, we're only down 0.41%."
A topping tail is a powerful candlestick pattern that occurs when buyers push prices to new highs during the session, only to be overwhelmed by sellers who force the price to close near its open. Psychologically, it represents an exhaustion of bullish momentum and a sudden shift in intraday control. When follow-through occurs on the subsequent trading day—as it did today—it often foreshadows a period of consolidation or a deeper retracement.
For the S&P 500, the immediate trendline support sits at 7,270 points. Should selling pressure intensify, the next critical floor lies at the top of a parallel channel at 7,095 points.
Meanwhile, the Nasdaq and the Russell 2000 (IWM) are exhibiting their own forms of technical digestion. The Nasdaq retested the top end of its parallel channel but managed to finish back above it. Until price action separates decisively from this channel, the market remains in a state of sideways consolidation.
The IWM, despite sitting near all-time highs, is battling an inclining trendline and neckline resistance. Interestingly, this sideways movement is doing exactly what it needs to do technically: cooling off the daily RSI. The RSI has pulled down to 64.7, working off its overbought condition while maintaining minor support at $268.44. This is textbook bullish consolidation—burning off excess froth without sacrificing significant price territory.
Even the semiconductor sector (SMH), which saw a 0.59% decline today, demonstrated underlying strength. Despite the pullback, the ETF printed two distinct bottoming wicks on the daily candles, indicating that institutional buyers are still eager to scoop up shares at support, currently sitting at $491.18.
The 10-Year Yield: The Macro Headwind Approaching 4.5%
While equity charts are showing standard technical consolidation, the bond market is flashing a warning sign that requires immediate attention. The 10-year Treasury yield hit a high of 4.462% today, marching steadily toward the psychologically and economically significant 4.5% threshold.
To understand the gravity of this move, we have to look back to late March, specifically March 27th, when yields last approached these elevated levels before retreating. The current full retrace back to this resistance zone is a critical macro development.
"Once we reach 4.5% and keep trucking higher, that's not necessarily gonna be good for people trying to get mortgages or people trying to take out loans to buy cars and/or businesses refinancing their debt…"
The relationship between the 10-year yield and the broader economy cannot be overstated. The 10-year acts as the benchmark for global borrowing costs. When it approaches 4.5%, the cost of capital for businesses increases, which can compress future profit margins. For consumers, it translates directly into higher mortgage rates and auto loan APRs, effectively acting as a tax on the middle class and slowing down discretionary spending.
For equity traders, rising yields typically pressure growth stocks—whose valuations are based on future cash flows discounted to the present day. If the 10-year yield breaks decisively above 4.5%, we could see the current "fractional" equity pullbacks accelerate into more meaningful corrections.
Precious Metals: Navigating the Technical Breakdown
The precious metals complex experienced significant technical damage today, offering a stark reminder of how quickly support can become resistance.
Gold plunged beneath its minor support level, setting its sights on the next critical floor at $4,494.85. If this level fails to hold, the yellow metal could be staring down a much deeper correction toward the sub-$4,200 range, specifically targeting $4,189. Conversely, any bounce from current levels will face formidable resistance at $4,800.
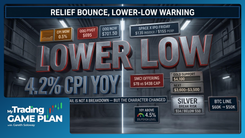
Silver's chart is arguably even more compelling. Last week, $75.33 acted as a reliable support floor, with price action piercing and bouncing off it multiple times. However, once a support level is tested too often, the buyers eventually become exhausted. Today, silver plunged beneath this line, flipping $75.33 into hard resistance. The technical probabilities now point toward a measured move down to $67.86.
However, for seasoned traders and investors, these technical breakdowns are not reasons to panic—they are shopping lists. Drew outlined his specific strategy for accumulating physical silver, targeting the 50% area of the parallel channel between $58 and $55 per ounce. This $55.09 level is not arbitrary; it perfectly aligns with major high pivots from October and November of 2025.
"Got to love this game of trading because as long as you can isolate levels of support and resistance, guys, you can rinse and repeat this until you pass away…"
This mindset separates professionals from amateurs. While retail traders often panic-sell during breakdowns, professionals patiently wait at historically significant Fibonacci and pivot levels to accumulate assets. Furthermore, holding physical precious metals serves as a tangible insurance policy against systemic risk—an asset class that carries no counterparty risk and has served as a store of value for millennia.
Energy Markets: Geopolitics and Chart Patterns
The energy sector remains a focal point of volatility, driven heavily by geopolitical tensions in the Middle East, particularly involving Iran. Yet, even in the face of unpredictable news headlines, the charts continue to provide a reliable roadmap.
US Oil surged 2.33% from Friday's close, but the intraday price action was where the real story unfolded. Looking at the 10-minute chart, oil formed a classic cup and handle pattern that evolved into a near-term bull flag. Price surged to kiss resistance at $107.46 before consolidating.
If geopolitical escalation continues to provide bullish momentum, oil faces a double-barrier of resistance: the bottom of the parallel channel at $110.83, immediately followed by a Fibonacci resistance level at $111.71. Should tensions de-escalate, the downside support target sits significantly lower at $94.95.
Natural gas, notorious for its erratic and often frustrating price action, is finally showing signs of life. After closing exactly on the critical "line in the sand" on Friday, natural gas pushed above the $3 mark today.
"You’ve got to recognize these small nuances in technical analysis."
Drew highlighted a tiny daily bottoming tail that formed back on April 24th. In the moment, it seemed insignificant amid the relentless testing of the $2.71 support level. However, that subtle candlestick was the market's way of foreshadowing the current upward push. If natural gas can secure a daily close above today's $3 high, the probabilities dramatically shift in favor of the bulls, targeting the bottom of the overarching parallel channel.
Crypto's Critical Juncture: The Rule of Three
The cryptocurrency market delivered the most explosive price action of the day, with Bitcoin finally piercing the massive psychological barrier of $80,000 to trade at $80,033.
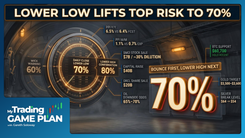
After clearing the previous hurdle at $73,173, Bitcoin's next logical target was the bottom of the daily candle from November 21st, sitting at $80,524. The 10-minute chart reveals a fascinating psychological battle at this exact level.
Bitcoin surged to a high of $80,613 before suffering a violent rejection that pulled the price all the way back to $78,212. It attempted to break this level two more times, resulting in three distinct rejections.
In technical analysis, there is a concept regarding the testing of resistance levels. The first hit is a shock. The second hit proves the level is real. The third hit absorbs the remaining supply. By the fourth hit, the resistance is often so weakened that price breaks through. If Bitcoin can muster the momentum for a fourth attempt, a breakout toward the inclining trendline at $85,400 is highly probable.
However, traders must not suffer from recency bias. Despite the bullish near-term price action, a massive macro Head and Shoulders pattern remains active on the Bitcoin chart. Unless Bitcoin can secure a daily close above the pattern's neckline, the overarching technicals still point to a potential catastrophic breakdown sub-$40,000.
"If you learn technical analysis, guys, you can trade anything, it doesn't matter what it is, it's as long as it's a chart, and we've got candlesticks to create patterns, you can trade anything, it doesn't matter."
This universal applicability of technical analysis was perfectly demonstrated by crypto-adjacent equities today. MicroStrategy (MSTR) jumped 3.74%, confirming a breakout above a declining trendline dating back to December 9th. With near-term support established at $164.40, MSTR is entirely dependent on Bitcoin's ability to break $80,500. If Bitcoin succeeds, MSTR is primed to retest $198.40, with an ultimate target of $239.03.
Similarly, Coinbase (COIN) surged 6.14%, aided both by Bitcoin's strength and emerging US legislation regarding stablecoins. The stock ran directly into a multi-year declining trendline originating in November 2021, piercing a gap fill at $206.24 before closing just under $203. For tomorrow, the trendline resistance sits at $206.27. A confirmed push through this level opens the door to $215, and eventually $225.47.
Earnings Shocks and M&A Tremors
While technicals govern the broad market, individual equities are currently being whipped around by fundamental catalysts.
eBay delivered a massive 5% gap up today, not on its own earnings, but on the shocking news that GameStop has floated a $55 to $56 billion takeover offer, pegging eBay's value at roughly $125 per share. The stock hit an intraday high of $111.38, gapping completely over a stubborn inclining trendline from October 2021.
Trading M&A news is notoriously dangerous due to regulatory hurdles and the potential for deals to collapse. Technically, eBay must hold support at $105.25. If it can, the top of the parallel channel at $114.73 is the next target. If the trendline fails, expect a rapid gap-fill pullback toward the $100 to $101 range.
On the darker side of corporate news, UPS suffered a devastating 10.48% plunge following Amazon's announcement that it will expand its own delivery services across ocean, trucking, and rail. This fundamental threat to UPS's market share caused the stock to slice right through near-term support at $97.44, hitting a low of $94.07.
When a stock suffers a fundamental breakdown of this magnitude, traders must look left on the chart to find historical support. For UPS, the next floor sits at $90.65, with a worst-case scenario pointing toward the September consolidation range down at $80.
Even the semiconductor space isn't immune to post-earnings punishment. ON Semiconductor dropped in after-hours trading, slipping sub-$100 to $97.97. However, the technical roadmap provides a clear buy zone for patient traders: a gap fill sits at $93.30, which perfectly aligns with the bottom of a sharp inclining parallel channel at $92.33. This confluence of factors creates a high-probability support zone worth monitoring closely tomorrow.
Conversely, NBIS demonstrated what true relative strength looks like, exploding 14.2% to brand new all-time highs. By clearing heavy consolidation, NBIS proved its momentum is genuine. Tomorrow, it faces a critical test at the top of its inclining parallel channel at $182.20.
Conclusion: The Discipline of the Chart
Today's market action perfectly encapsulates why traders must rely on price action rather than emotion or headlines. Whether it is the S&P 500 printing a topping tail, the 10-year yield threatening the 4.5% threshold, Bitcoin battling the $80,524 resistance, or UPS plunging on competitor news, the charts provide the ultimate source of truth.
The beauty of technical analysis is its absolute objectivity. It doesn't care about your bias, your hopes, or the latest news cycle. It simply measures human psychology—fear, greed, and exhaustion—plotted on an X and Y axis.
As we continue to navigate this volatile earnings season, the key to survival and profitability lies in patience. Wait for the S&P to test its 7,270 support. Wait for Bitcoin to prove it can break its triple-top resistance. Wait for ON Semiconductor to hit its $92.33 channel bottom. By letting the price action come to your predetermined levels, you remove the emotion from trading and place the mathematical probabilities firmly in your favor.
Trading involves substantial risk. All content is for educational purposes only and should not be considered financial advice or recommendations to buy or sell any asset. Read full terms of service.