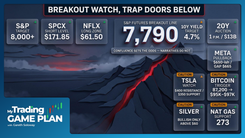
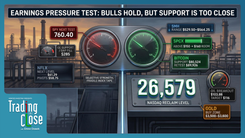
Trading The Close Market Recap - 09/17/2026: Relief Rally Sparks Tech & Semiconductor Breakouts as 10-Year Yield Falls

Thursday’s rally was less about forgetting Wednesday’s Federal Reserve rate hike than about how the bond market digested it.
The Fed raised its benchmark rate by 25 basis points to 3.75%-4.00%, its first hike since 2023, and signaled that additional tightening remains possible. Stocks initially struggled with that message. By Thursday, however, the 10-year Treasury yield had retreated below 5%, taking pressure off many of the areas that had been hit hardest by rising rates.
That shift produced broad relief across technology, semiconductors and precious metals. But Drew Dosek’s central point on Trading The Close was not simply that Thursday was bullish. Several charts have now pushed into or through important technical levels, and the next daily close will help determine whether those moves have staying power.
The 10-Year Yield Remains the Market’s Pressure Gauge
The 10-year yield has become one of the cleaner directional filters for risk assets.
After moving above 5% earlier in the week, the yield pulled back Thursday as investors digested the Fed’s quarter-point hike and its more hawkish stance. The decline coincided with a 1.1% gain in the S&P 500 and roughly 1.6% advance in the Nasdaq.
Drew is not looking for the yield to collapse from here. His chart instead leaves room for consolidation inside an ascending parallel channel, with support near 4.886% and 5.021% remaining an important level overhead.
That matters because another push higher in yields could reapply pressure to long-duration technology and precious metals, while continued cooling would give those groups more room to recover.
The relationship is not mechanical on every session, but right now yields remain one of the clearest variables connecting the major setups on Drew’s board.
S&P 500 and QQQ Need Follow-Through
Thursday’s rally improved the technical picture for the major indices, but one strong candle does not finish the job.
The S&P 500 gained roughly 1.1% after several sessions of pressure. Price reclaimed a horizontal level tied to the June highs and bounced after testing it from above.
More importantly, Thursday’s candle pushed through the short-term descending structure that had contained the recent pullback. Drew wants to see another strong daily close that creates additional separation from that trend before treating the move as a more durable shift.
QQQ made an even cleaner move. The ETF reclaimed its gap area and closed above its declining trendline in one session. Another close above Thursday’s range would strengthen the breakout case and put the next declining resistance line, near $727 on Drew’s chart, back in focus.
The distinction is simple: Thursday created the setup. Friday can help confirm it.
Semiconductors Are Trying to Turn the Corner
Semiconductors were among Thursday’s strongest groups as Treasury yields eased and investors moved back toward AI-linked names.
A recent Goldman Sachs report cited research projecting that the AI-server market could reach roughly $1.3 trillion by 2030, reinforcing the longer-term infrastructure story even after the sector’s recent pullback.
SMH gained sharply and broke above the declining trendline that has repeatedly interrupted prior rebound attempts. Drew’s next test is the 50-day moving average near $565.48.
That makes Friday important. SMH has struggled to build sustained follow-through after previous attempts to clear this trendline. Holding above it and pushing toward the 50-day would give the rebound more technical weight. Slipping back beneath it would leave Thursday looking more like another failed breakout attempt.
SMCI: Strong Move, Bigger Resistance Still Ahead
Super Micro Computer surged Thursday, extending a rebound inside what Drew reads as a large bull-flag structure.
The first resistance sits near $42.05 at the top of the current parallel channel. Above that, two larger trendlines converge near $47.41, creating the more important resistance zone on the chart.
That area is significant because multiple technical references arrive at roughly the same price. Rather than assuming a reversal there, Drew is treating it as the zone where the bullish move would face its more meaningful test.
SMCI also continues to carry an export-control and legal backdrop tied to alleged diversion of advanced chips to China. The company itself was not charged in the March federal case, and a later internal investigation said it found no evidence that senior management participated in the alleged scheme.
Intel and AMD: Let the Breakout Prove Itself
Intel and AMD both joined Thursday’s semiconductor rebound.
Intel closed above its declining trendline, with Drew watching $112.07 as the next resistance level if the breakout holds. AMD is in a similar position, with a confirmed continuation potentially putting $566.41 back in focus.
Drew’s preferred approach to moves like these is the breakout retrace.
Instead of chasing a stock after a large expansion candle, he waits to see whether the breakout holds and then watches for price to revisit the former resistance area. If buyers defend that level as support, the chart offers a cleaner technical reference than buying into an already extended move.
That is less about predicting an automatic bounce and more about waiting for price to prove that prior resistance has changed roles.
Apple and HPE Add to the Technology Rebound
Apple is also participating in the broader technology recovery.
A report this week said Apple is exploring an AI inference server built around its own M8 Ultra chips and is considering Nvidia’s NVLink Fusion technology. The project remains tentative, but it adds another angle to the market’s AI-infrastructure narrative.
Technically, Apple has been trading near the upper portion of an ascending parallel channel extending back to 2023. Thursday’s move filled the gap associated with the prior all-time-high candle.
Drew’s read is that holding the reclaimed area keeps another attempt at the highs in play, with resistance near $350.
Hewlett Packard Enterprise is testing an even more obvious ceiling.
The stock has repeatedly challenged the $60-$62 area, including another push toward that zone Thursday. Repeated tests can weaken resistance as available supply is absorbed, which makes the $61.85 area particularly important.
A daily close through that level would give Drew the confirmation he wants before treating the range as broken.
Bitcoin Shows Why the Closing Price Matters
The same confirmation principle is showing up in Bitcoin.
Bitcoin recently tested the August pivot low near $75,538 but avoided confirming a breakdown on a closing basis. Price closed around $75,584 instead, keeping the prior daily structure intact despite trading below the pivot intraday.
That difference is small in dollar terms relative to Bitcoin’s price, but technically it matters.
The intraday break showed selling pressure. The close showed that sellers still had not established acceptance beneath the prior pivot.
Bitcoin has since moved back toward the midpoint of Drew’s declining parallel channel. He is watching roughly $76,535 next, followed by $78,362 if price can continue working through the channel.
The takeaway is not that the $50 difference in the close guarantees anything. It is that the breakdown never received the confirmation Drew requires.
Gold and Silver Erase Their Breakdown Attempts
Falling yields also helped precious metals recover from setups that had been threatening to turn bearish.
Gold rallied back inside its ascending parallel channel after briefly slipping beneath support. Because price never created meaningful separation below the trendline and then reclaimed it, Drew no longer treats the earlier move as a confirmed breakdown.
The first resistance level on his chart sits near $4,575.
Silver produced a similar reversal.
Price had been threatening the neckline of a head-and-shoulders structure, but sellers failed to extend the move toward the lower support region around $56-$57. Thursday’s rebound carried silver back through the breakdown area.
That failed follow-through weakens the bearish pattern and shifts attention back toward overhead resistance near $67.99.
This is exactly why confirmation matters. A pattern can look complete intraday and still fail if price cannot hold the break.
Oil Holds Its Bullish Structure
Oil also stabilized Thursday after pulling back from its recent highs.
Drew’s chart continues to show an active inverse head-and-shoulders structure, with support first near the midpoint of the ascending channel and then around the 93.19 Fibonacci retracement.
On the upside, $106.40 and $108.26 are the next barriers. If those levels are cleared, the larger measured move near $116.50 remains the technical projection from the pattern.
Natural gas is less developed. Thursday left an upper wick, but price remains inside the recent consolidation range.
One wick does not materially change the structure. Several repeated upper wicks, however, would show sellers consistently rejecting intraday strength and would make Drew more cautious about the current setup.
For now, the declining trendline near $3.23 remains the next level on his chart.
Bottom Line
Thursday’s rally improved a lot of charts, but it did not settle them.
The 10-year yield backed away from 5%, easing one of the pressures that had weighed on technology, semiconductors and precious metals. That allowed several assets to reclaim trendlines or erase developing breakdowns.
Now comes the more useful information.
SMH needs follow-through. QQQ needs to hold its breakout. Bitcoin needs to keep closing above the structure sellers have repeatedly tested. Gold and silver need to prove that Thursday’s reversals were more than one-day recoveries.
That is the common thread across Drew’s charts: the move gets attention, but the close determines whether the technical structure actually changed.
Trading involves substantial risk. All content is for educational purposes only and should not be considered financial advice or recommendations to buy or sell any asset. Read full terms of service.