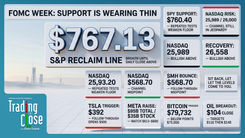
Trading The Close Market Recap - 10/28/2026: Sticky Inflation, Tech Divergence & Historic Oil Setup

S&P 500 Holds Support as Nasdaq Faces Resistance: Key Market Levels After the Fed
Trading the Close Market Review | October 28, 2026
The Federal Reserve's latest policy decision may have given markets a reason to move higher, but the more important question is whether the technical structure supports continued upside. The S&P 500 is holding its rising trendline, the Nasdaq remains pinned beneath resistance, and several major technology stocks are showing sharply different reactions to earnings. The broader market has not broken down, but the charts are not delivering a unified bullish signal either.
That divergence was central to Pro Trader Drew Dosek's October 28 edition of Trading the Close at VerifiedInvesting.com. With inflation data approaching and earnings volatility creating significant moves across individual stocks, Drew focused on the levels that could determine whether the current consolidation develops into another leg higher or begins to lose momentum.
The takeaway is straightforward: Holding support is constructive, but it is not the same as confirming a breakout. Until buyers establish separation above resistance, traders need to distinguish between a market that is holding together and one that is ready to advance.
S&P 500 Technical Analysis: Support Holds While Nasdaq Tests Resistance
The S&P 500 continues to show relative technical strength after reclaiming its rising trendline. That move puts buyers back in a more favorable position, but the next test is whether the index can maintain that structure as earnings reactions work their way through the market.
Drew identified 768.42 as an important support level on the chart he was reviewing, with an upside gap-fill level at 778.06. Holding the lower level would preserve the near-term constructive setup, while a sustained move toward the gap would suggest buyers are maintaining control. A decisive break below support, however, would weaken that interpretation and raise the possibility of a deeper pullback.
The Nasdaq presents a different picture. The technology-heavy index finished near a declining trendline connected to the September 21 breakout area and the October 6 topping candle. The key level is 26,560, where a daily close above resistance would provide evidence that buyers are beginning to overcome the recent pattern of rejection.
This is the divergence worth watching. The S&P 500 is defending its rising structure while the Nasdaq still needs to prove it can break through overhead supply. If technology cannot participate more convincingly, the broader market may have difficulty sustaining its advance, even if the major indexes continue to hold their immediate support levels.
Semiconductor ETF SMH: Why Long-Term Trendline Resistance Still Matters
The VanEck Semiconductor ETF (SMH) provided one of the clearest examples of Drew's approach to technical analysis. A parallel channel established in April 2025 continues to influence price behavior, with its 50% line acting as an important reference point.
SMH advanced toward the \$568.50 resistance area, reached approximately \$571, and then pulled back toward \$567.67. After four consecutive positive candles from the lower portion of its structure, the ETF encountered a level where sellers had a technical reason to become more active.
The significance is not that a trendline predicted the exact high. It is that a previously established level remains relevant as traders evaluate where momentum may stall, where profits could be taken, and what would constitute a confirmed breakout.
Drew emphasized that trendlines remain useful until price breaks them. That principle matters because traders do not need every technical level to hold indefinitely. They need a framework for recognizing when price is respecting a level and when the market is providing evidence that the structure has changed.
For SMH, consolidation between approximately \$557 and the channel midpoint would allow the recent advance to stabilize without necessarily damaging the broader setup. A confirmed move above resistance would strengthen the bullish case, while sustained weakness below the consolidation area would suggest the rally needs more time.
10-Year Treasury Yield Outlook: Inflation Data Could Test Equity Momentum
The 10-year Treasury yield remains an important part of the equity-market equation. Drew's chart showed the yield consolidating near a declining trendline around 4.959%, with overhead resistance at 5.021% and 5.068%.
Those levels matter because a renewed advance in yields could put pressure on equity valuations, particularly in growth-oriented sectors where expectations for future earnings play a larger role in pricing.
For now, the yield's sideways movement has limited that additional pressure. However, the upcoming Personal Consumption Expenditures inflation report could change the outlook quickly if the data materially alters expectations for Federal Reserve policy.
The important distinction is between yields stabilizing and yields reversing lower. Stability can give equities room to consolidate, but a sustained move above the identified resistance levels would introduce another obstacle for stocks already struggling with technical resistance.
Microsoft and Alphabet Earnings: Why Big Tech Is Sending Mixed Signals
Earnings season is reinforcing the broader market divergence, with Microsoft and Alphabet presenting contrasting technical pictures in the supplied recap.
Microsoft's chart showed strength following earnings, including an after-hours move toward \$565 before pulling back beneath a previous pivot around \$552. Drew identified the rising trendline near \$567 as an important resistance area. A sustained move through that level would support a continuation setup, with \$600 representing a longer-range psychological reference rather than a confirmed destination.
Alphabet's chart, by contrast, showed a sharp decline that broke beneath a parallel channel extending back to November 2024. The move also challenged a major Fibonacci retracement, suggesting that the previous technical structure was no longer providing reliable support.
When a stock breaks multiple levels in a short period, the temptation is to assume that a deeply oversold reading guarantees a rebound. That is not how Drew's framework works. Oversold conditions can persist, particularly when a major catalyst forces investors to reassess a stock.
The supplied chart analysis identified potential gap-fill areas near \$287 and \$272 to \$275. These are zones to monitor for stabilization, not automatic entry signals. Traders would want evidence that selling is slowing and buyers are defending a level before treating either area as meaningful support.
The broader lesson extends beyond these two companies. Strong earnings reactions in one technology leader do not automatically offset technical damage in another. What matters for the indexes is whether enough large components can sustain their advances to overcome weakness elsewhere.
Bitcoin Price Analysis: Why Repeated Support Tests Increase Breakdown Risk
One of Drew's most useful lessons from the session concerned the way support can weaken after repeated tests.
He compared a heavily tested support level to a net. Each additional impact can create more openings until the structure eventually gives way. The analogy captures an important feature of market behavior: repeated tests do not automatically make a level stronger.
Bitcoin offered an example. After several sessions of testing support, BTC attempted to recover but had not established enough upward separation to remove the immediate risk of another test.
Drew identified \$81,182, the prior session's high on his chart, as an important level for buyers to reclaim on a daily closing basis. A close above that reference would provide evidence of improving short-term momentum. Continued trading beneath it would leave Bitcoin vulnerable to renewed pressure on support.
The lesson is not that every repeated support test must end in a breakdown. It is that traders should pay attention when rebounds become less convincing and buyers struggle to move price away from a level they have repeatedly defended.
Natural gas showed a similar pattern. Price had tested a support confluence near \$3.08 to \$3.11 for four consecutive sessions, combining a horizontal breakout level with a rising trendline. A move toward declining resistance around \$3.20 would indicate buyers were beginning to regain control, while a daily close below \$3.08 would weaken the existing structure and increase downside risk.
Across both charts, the key is the same: support is most useful when buyers can demonstrate that they are capable of moving price away from it.
Crude Oil Price Outlook: The \$103.53 Breakout Level and \$148 Measured Move
Crude oil may be one of the more consequential charts in Drew's broader market framework because a sustained advance in energy prices could complicate the inflation outlook.
The chart already showed a smaller inverse head and shoulders breakout with a measured move objective near \$116. More importantly, Drew was monitoring a larger potential inverse head and shoulders formation, with a neckline around \$103.53.
A confirmed daily close above that neckline would strengthen the larger bullish pattern and establish a theoretical measured move toward the \$148 area. That projection is notable because it approaches the historic 2008 crude oil high near \$147.79.
However, a measured move is a technical projection, not a forecast that price must reach the objective. Previous highs, changing demand expectations, supply developments, and broader macroeconomic conditions can all influence whether the pattern follows through.
For traders, the \$103.53 neckline is the more immediate decision point. A breakout that holds above it would support the larger upside scenario. A failed breakout that sends price back beneath the neckline would weaken that interpretation and raise the risk of a reversal.
This also connects the oil chart to the broader equity-market thesis. If energy prices accelerate higher while Treasury yields are already near important resistance, inflation concerns could become another challenge for stocks attempting to break out.
Gold and Silver Technical Analysis: Key Resistance Levels to Watch
Precious metals are also approaching levels that could determine their next directional moves, although gold and silver are showing different technical characteristics.
Gold remains near the \$4,000 area, with Drew identifying \$4,104 as the key overhead resistance level. A daily close above that threshold would improve the bullish structure and suggest buyers are regaining momentum. Failure to clear it would keep attention on lower support, including a rising trendline near \$3,600 and a broader reference area around \$3,500.
Silver has shown more persistent buying interest near its recent lows, with four consecutive candles displaying lower wicks. Those wicks suggest buyers have been responding to weakness, but they do not independently confirm that the consolidation has ended.
The level to watch is \$54.75. A daily close above that resistance would improve the technical picture and bring \$59.20 into focus as the next major reference point. Until then, the lower wicks remain evidence of buying interest within a structure that still requires confirmation.
GE HealthCare, F5 Networks, Vertiv and FedEx: Earnings Setups Worth Watching
Several individual stocks illustrated why patience matters during earnings season. Large price moves can create attractive technical structures, but the first reaction is not always the best place to evaluate a trade.
GE HealthCare (GEHC) moved above an inverse head and shoulders neckline near \$75.49 following its earnings report. The chart showed an RSI near 72.77, indicating overbought conditions after the advance. Drew identified \$77.88 as an important level for confirming continued strength, with a potential retest of the broken neckline offering a way to evaluate whether former resistance can become support. The larger pattern carries a measured move objective near \$92.93, although that outcome depends on the breakout holding.
F5 Networks (FFIV) showed the opposite reaction, with a sharp decline through the midpoint of a multi-year parallel channel. Drew highlighted a potential support zone between approximately \$345 and \$353.53, where a previous pivot and Fibonacci retracement create technical confluence. A rebound from that area could bring \$367 to \$370 back into view, followed by resistance near \$376.38. However, the size of the decline makes confirmation particularly important, since an apparent support zone can fail when selling momentum remains elevated.
Vertiv (VRT) advanced sharply but approached a resistance cluster between \$250 and \$253. The combination of a round-number level, a gap fill, and a declining trendline gives traders a defined area to monitor for rejection or consolidation. A sustained breakout would change the setup, but the presence of multiple resistance factors argues against assuming that the initial rally will continue uninterrupted.
FedEx (FDX) presented a bearish structure, with price breaking below a head and shoulders neckline near \$313 and trading around \$297 after hours in the supplied analysis. The pattern's measured move points toward the \$250 region, where previous pivots may provide support. That level remains a conditional technical objective, not a guaranteed destination.
Taken together, these setups reinforce a consistent principle: earnings create movement, but the chart determines where a trader can evaluate the risk. The strongest opportunities are not necessarily the stocks making the largest moves. They are the ones where price reaches a meaningful level and then provides evidence that the expected reaction is developing.
Market Outlook: What Traders Should Watch After the Fed Decision
The next phase of the market will depend on whether the major indexes can build on their current structure while absorbing earnings volatility and the next inflation report.
The S&P 500 remains constructive while its identified support holds, but the Nasdaq needs a confirmed close above 26,560 to improve its technical picture. Semiconductors are testing a long-standing channel boundary, and the 10-year Treasury yield is sitting near levels that could become important if inflation expectations shift.
At the same time, Bitcoin and natural gas are demonstrating why repeated support tests deserve attention, while crude oil presents a larger potential breakout that could have implications beyond the energy market.
These are not independent observations. Together, they show a market where the broader trend has not necessarily failed, but confirmation remains uneven. Some charts are defending support, others are approaching resistance, and several major stocks are still processing the effects of earnings.
The next session should help clarify whether buyers can generate sustained follow-through or whether the current divergence begins to weigh more heavily on the indexes.
Bottom Line: Let Price Confirm the Trade
The central lesson from Drew Dosek's October 28 Trading the Close is that technical levels are most valuable when they help traders make decisions without having to predict every market move.
The S&P 500 holding support does not guarantee another rally. The Nasdaq approaching resistance does not guarantee a rejection. An oversold stock is not automatically a buying opportunity, and a measured move does not promise that price will reach its target.
What matters is how price behaves at the levels that have already been identified.
With inflation data approaching and earnings reactions continuing to reshape individual charts, traders have plenty of potential setups to monitor. The advantage comes from knowing which levels matter, what would confirm the thesis, and what would invalidate it.
For traders looking to prepare before the opening bell, Verified Investing's new weekday morning show, Pro Trader Firepower, premieres Monday, November 2, at 8:15 a.m. Eastern. The show will focus on the macro environment, market-moving headlines, and technical setups to help viewers build a framework for the trading day.
The market does not need to move exactly as expected for a trading plan to be useful. It needs to provide enough information to determine whether the original thesis still holds.
Trading involves substantial risk. All content is for educational purposes only and should not be considered financial advice or recommendations to buy or sell any asset. Read full terms of service.