
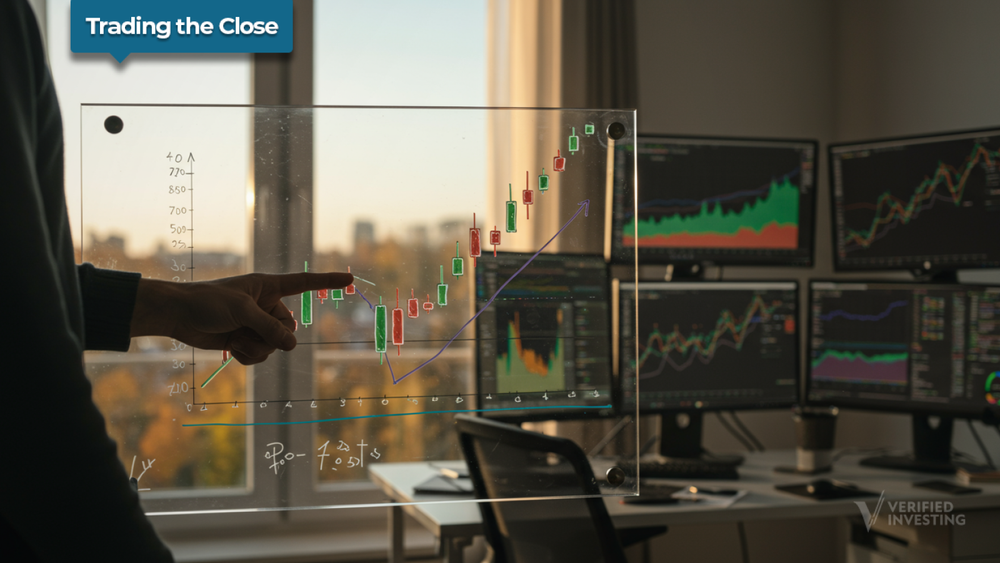
Trading The Close Market Recap - 10/29/2025: Powell’s Rate Twist: Tech Outperforms as Small Caps Tumble
In this afternoon's Trading The Close episode, Pro Trader Drew Dosek at Verified Investing broke down a pivotal day for the markets. The long-awaited commentary from Federal Reserve Chairman Jerome Powell delivered a mix of expected news and a surprising dose of cold water, sending ripples across every asset class. The market’s reaction was immediate and telling, revealing a deep divide between the resilient tech sector and the more vulnerable broader market. Today’s article will expand on the key takeaways from the show, exploring the implications of the Fed’s new stance, the critical technical levels that have emerged, and the powerful charting techniques that can help traders navigate this complex environment.
Powell's Policy Whiplash and the Market's Reaction
The market got the news it was anticipating when Jerome Powell confirmed a 25-basis point interest rate cut for the current month. However, the certainty that many had priced in for a subsequent cut in December was abruptly challenged. Powell’s comments suggested a second cut was far from a sure thing, a sentiment that immediately reset market expectations. As Drew noted, this shift was quantifiable and dramatic:
"Now the CME Watch Tool for December is saying a 55.5% chance of a 25-basis point cut in December. That was much higher. It was over 80 earlier in the week, and then now all of a sudden, everything's starting to change."
This recalibration from over 80% certainty to a near coin-flip probability sent a shockwave through interest-rate-sensitive assets. The S&P 500, which had been positive, plunged into negative territory, ending the day down 0.1%. The 10-year Treasury yield, which should theoretically fall in a rate-cutting environment, popped higher as the market priced in the new uncertainty. This seemingly contradictory move highlights a crucial market dynamic: markets trade not on what is happening now, but on what is expected to happen next. The removal of a "foregone conclusion" for December was a more powerful catalyst than the confirmation of the current month's cut.
A Tale of Two Markets: Tech vs. The World
A glance at the S&P 500 heat map for the day painted a stark and revealing picture: a sea of red punctuated by islands of vibrant green. While sectors like finance, utilities, and retail saw widespread selling, a handful of mega-cap technology stocks single-handedly propped up the Nasdaq, which closed up 0.33%. This isn’t a new phenomenon, but today it was particularly pronounced.
Leading the charge were names central to the artificial intelligence and data center narrative: Palantir surged 4.9%, NVIDIA gained 2.92%, Broadcom (AVGO) jumped 3.57%, and Google climbed 2.7%. This bifurcation underscores a major theme in today’s market: capital is flowing into a very narrow group of companies perceived as being insulated from broader economic headwinds, largely driven by the secular growth story of AI. As Drew pointed out, this is a continuation of a recent trend:
"We clearly see there's a disparity going on here in the markets… We see all the money going to tech, and then the rest of the markets, people are retreating off of this news. Very interesting. This isn't the first day. Yesterday, if you remember, very similar heat map that we displayed."
This concentration of strength creates a deceptive market environment. While the Nasdaq posts gains, the underlying health of the broader market, as reflected in the widespread selling across most other sectors, is deteriorating. For traders, this means index-level analysis alone is insufficient; understanding the internal dynamics and sector rotations is paramount.
Small Caps Feel the Chill of Rate Uncertainty
Nowhere was the impact of Powell’s comments on December felt more acutely than in the small-cap space. The Russell 2000, tracked by the IWM ETF, took an immediate hit. This reaction is fundamentally logical. Unlike the cash-rich behemoths of the tech world, many small-cap companies are not yet profitable and rely heavily on access to affordable credit to fund operations and growth. The prospect of interest rates staying higher for longer directly threatens their business models and solvency.
Technically, the IWM sold off sharply but found critical support right at the bottom of a well-defined parallel channel, at approximately $244.69. This level has been tested several times in recent weeks, making it a crucial line in the sand. A failure to hold this support would have significant bearish implications. The next major support level corresponds with a gap fill from a previous rally, located down around the $237 mark. The price action in the IWM serves as a real-time barometer for the market’s assessment of economic health and credit conditions.
The Unrivaled Power of Parallel Channels
A recurring theme throughout today's analysis was the remarkable effectiveness of parallel channels in defining price action across various timeframes and assets. Drew repeatedly demonstrated how these simple technical constructs provide a clear and actionable roadmap for traders.
- Seagate Technology (STX): After reporting a strong beat on earnings and revenue, STX surged to new all-time highs. Its entire rally since April has been perfectly contained within an inclining parallel channel. The next logical resistance target is now the top of that channel, near $286.
- Garmin (GRMN): In a classic "sell the news" reaction, Garmin tumbled over 11% despite a slight EPS beat, as investors focused on a minor revenue miss. The stock is now heading directly towards the bottom of a parallel channel that dates back to November 2023, with ultimate support projected around the $200 level.
- Teradyne (TER): Following a massive 20% post-earnings surge, Teradyne’s chart presents a fascinating technical picture. The move broke the stock out of a declining trendline, but it is now approaching a much longer-term resistance line connecting pivots from the year 2000 and 2021. This places the stock "bookended" between major support and resistance, setting the stage for its next directional move.
Drew’s affinity for this tool is rooted in its utility and clarity: "The parallels are so powerful because they give you so much information over a long period of time… They help me understand charts a lot better. They help me gauge new levels, whether they be on the high end of the chart or maybe contained near the low end of the chart." This methodology transforms a chaotic chart into a structured map of probabilities, support, and resistance.
Consolidation: The Key to Sustainable Momentum
In his analysis of Teradyne's explosive move, Drew shared a crucial piece of trading wisdom that transcends any single chart pattern: the importance of consolidation. While a 20% gap-up is exciting, its sustainability is questionable without a period of stabilization.
"Consolidation is key for staying power on stocks. If you have stocks just going straight up, they typically are met with equal selling pressure straight back down."
This concept is rooted in market psychology and structure. Consolidation, or sideways price action, allows the market to digest a significant move. It shakes out weak hands, allows stronger conviction buyers to accumulate positions, and builds a base of support. This process builds the energy, or momentum, required for the next leg of a trend. A move that lacks consolidation is often built on a weak foundation, making it susceptible to a swift and sharp reversal. For a stock like Teradyne, a period of consolidation, even a slight pullback, before re-attacking the major resistance near $178 would be a far healthier and more bullish development than another immediate vertical push.
A Critical Lesson on Leveraged ETFs
Responding to a viewer request to analyze the SOXS (Direxion Daily Semiconductor Bear 3X Shares), Drew provided an invaluable piece of education for all traders. He explained why applying technical analysis directly to a leveraged ETF is a flawed and dangerous strategy.
"Analyzing this chart won't do you any good. This is a three-time leveraged ETF… you don't want to analyze this chart. You want to go to the single ETF and analyze that chart because the reason being, these multiplied ETFs will eventually go to zero."
Due to the mathematics of daily rebalancing and decay, leveraged products are not designed for long-term holding and their charts do not accurately reflect the technical health of the underlying sector. The correct approach is to analyze the non-leveraged ETF, in this case, the SOXX (iShares Semiconductor ETF).
His analysis of the SOXX revealed that, much like the broader QQQ and SMH, it has formed a doji candle at the top of its recent rally, signaling indecision. It remains within a clean, inclining parallel channel that has defined its trend since the April lows. Support lies at the 50% line of the channel just under $300, while resistance is at the top of the channel near $319.45. Decisions to trade the leveraged product (SOXS) should be based entirely on the signals generated by the underlying, non-leveraged chart (SOXX).
Conclusion: Navigating a Market at a Crossroads
Today’s session was a masterclass in reacting to new information while staying grounded in disciplined technical analysis. The Fed has introduced a new layer of uncertainty into the market, and the price action has revealed a clear fault line between the AI-driven tech titans and the rest of the economy. Small caps are flashing warning signs, while the broader indices are being held aloft by a narrowing group of leaders.
In this environment, a clear analytical framework is more important than ever. The power of tools like parallel channels to define risk and reward, the understanding of price action concepts like consolidation, and the discipline to avoid analytical traps like charting leveraged ETFs are what separate successful traders from the crowd. The market has been given its new marching orders, and the charts are providing the roadmap for what comes next.
Trading involves substantial risk. All content is for educational purposes only and should not be considered financial advice or recommendations to buy or sell any asset. Read full terms of service.


