Trading The Close Market Recap - 11/04/2025: Tech Sell-Off, AI Profit-Taking & Crypto Security Shock

In a market that has been relentlessly pushing higher, today served as a stark reminder that gravity still exists. The technology sector, which has been the engine of the 2025 rally, led the charge lower, pulling the major indices down with it. In this afternoon's Trading The Close, Pro Trader Drew Dosek of Verified Investing dissected the price action, revealing how the warning signs of this pullback were foreshadowed in the charts and why this profit-taking may have been both necessary and predictable.
Today's article will expand on the critical themes from the show, exploring the cracks appearing in the AI narrative, the powerful technical signals that forecasted this weakness, and the security crisis that sent shockwaves through the cryptocurrency markets.
The AI Narrative Meets Profit-Taking
For months, the artificial intelligence narrative has been a powerful tailwind for tech stocks, pushing valuations to dizzying heights. Today, however, we witnessed a classic case of "buy the rumor, sell the news," with Palantir serving as the poster child. Despite reporting its best earnings ever, the stock was pummeled, closing down 8.58%. This wasn't an isolated incident; it was a symptom of a broader theme.
As Drew highlighted on the show, this weakness was telegraphed. “This was foreshadowed in yesterday's show when I was talking about Palantir and also displaying Amazon how it was weak after getting a big pop-up from the OpenAI partnership.” Amazon, another AI beneficiary, continued its slide today, falling 1.9%. The selling pressure was widespread across the tech landscape, hitting names like Oracle (-4.34%), Salesforce (-2.68%), and Qualcomm (-4.41%).
This dynamic reveals a crucial lesson about market psychology. When a sector becomes as crowded and celebrated as AI has, the bar for success is raised exponentially. Even stellar results, like Palantir's, can fail to impress a market that has already priced in perfection and is looking for an excuse to take profits. After a monumental run-up—Palantir is still up approximately 200% from its 2025 lows even after today's drop—investors are showing that they are becoming more selective and wary of valuations. The AI play, at least for the near term, appears exhausted.
Technical Warnings on the S&P 500
While the narrative shift in AI provided the "why" for today's sell-off, the technicals provided the "when." On the S&P 500 (SPX), a confluence of powerful warning signs emerged that disciplined traders were watching closely. Drew pointed to a particularly telling formation on the weekly chart: a topping tail. This occurs when price pushes to a new high during the week but closes significantly lower, indicating a rejection at higher levels and a shift in momentum from buyers to sellers.
Even more precisely, the chart displayed a powerful timing signal. “If you count these candles, we've got an exact 30 time count straight up on the charts,” Drew noted. Time count analysis, a sophisticated technique taught in Verified Investing's educational courses, identifies cycles in the market. A completed count often signals trend exhaustion and an impending reversal. The appearance of a 30-count high, combined with a weekly topping tail, created a high-probability setup for a pullback.
Translating this to the S&P 500 ETF (SPY), we see the price has now plunged back inside its long-term parallel channel that has contained the uptrend since 2020. This break of the recent upward momentum brings a key support level into focus around the 672.69 area. While the market is still up a healthy 15% on the year, this technical breakdown suggests that the froth is being skimmed off the top, and a period of consolidation or further correction could be underway.
Crypto's Crisis of Confidence
The risk-off sentiment was not confined to equities; it hit the cryptocurrency market with brutal force. Bitcoin plunged over 5.5%, briefly piercing the psychologically critical $100,000 level. More importantly, it broke below the long-term parallel channel that has defined its 2025 bull run. But this sell-off wasn't just technical; it was driven by a fundamental crisis unfolding in its sister currency, Ethereum.
A major security breach on the Ethereum network has resulted in over $100 million being stolen in the last week alone. This event has cast a dark shadow over the entire decentralized finance (DeFi) space. As Drew explained, this is not a minor issue. “Just in 2025, there's been over two billion dollars stolen in cryptocurrency. So that's raising a lot of concerns.”
This string of high-profile hacks exposes the Achilles' heel of the crypto world: security. While the promise of decentralization is alluring, the reality of irreversible, nine-figure thefts is a massive deterrent for institutional and retail investors alike. It raises difficult questions about the viability of these networks for storing significant wealth without better security and, potentially, regulation.
For Ethereum, the technical damage is severe. The price has shattered support at $3,500 USD and is now testing a support zone between $3,000 USD and $3,100 USD. If this level fails, the next major target is a multi-year trendline dating back to June 2022, which could bring prices down toward the $2,500 USD to $2,700 USD range. While this could present a "Goldilocks" buying opportunity for long-term believers, it is contingent on the Ethereum network proving it can secure its platform.
Key Sectors Under the Microscope
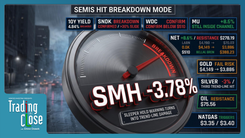
Beyond the major indices, specific sectors are flashing critical signals. The semiconductor ETF (SMH), often seen as a leading indicator for the broader tech market, lived up to its reputation today by leading the way down with a 3.64% loss. Like the S&P 500, the SMH chart also showed a completed time count setup, signaling exhaustion at the top. The next logical target for this pullback is a retest of the breakout area from early October, around the $346.90 level.
Meanwhile, small-cap stocks, represented by the IWM, are facing their own set of headwinds. Recent hawkish commentary from Fed Chair Jerome Powell regarding the possibility of rate cuts has disproportionately hurt smaller companies, many of which rely on debt to fund operations. Today, the IWM confirmed a technical breakdown below its blue parallel channel. A common pattern after such a break is a retest of the broken trendline from below before heading lower. Should this pattern play out, the next major support for the IWM sits at $237.33 USD.
Individual Setups in a Volatile Market
Even in a down market, opportunities and key levels emerge for individual stocks.
Tesla (TSLA): As the biggest loser among the mega-caps, Tesla fell 5.21% after being sharply rejected from resistance at $457.27 USD. However, this pullback doesn't necessarily negate the larger bullish picture. A massive inverse head and shoulders pattern remains in play, with a long-term target of $512.97 USD. The current drop could present a buying opportunity for a medium-term swing trade as it approaches support levels at $395.17 USD and $381.37 USD.
Hertz (HTZ): In a sea of red, Hertz provided a bullish counterpoint. The company reported spectacular earnings, with earnings per share up 267% and a surprise revenue beat. The price surged to a key declining trendline before pulling back. On the weekly chart, a large bull flag pattern is forming. A confirmed breakout above this trendline (currently just over $7.00 USD) would trigger a major buy signal, with upside targets at $9.29 USD and potentially as high as $15.00 USD.
Micron (MU): This viewer-requested chart served as a perfect example of a false breakout. After fighting to get above a key inclining trendline, the stock staged a nasty reversal today, plunging back below it. This "rug pull" was also preceded by a completed time count, warning traders not to chase the highs. With the breakdown confirmed, the next level of support to watch is down at $208.50 USD.
Conclusion: Reading the Data the Market Gives You
Today's market action was a powerful lesson in listening to the charts. The sell-off wasn't a random event; it was the logical resolution of narrative exhaustion in the AI sector and clear technical warning signs in the major indices. As Drew consistently emphasizes, the market provides us with an immense amount of information each day.
“Every single day, these candles give us a boatload of data that we can now interpret and decide where we're going to be going in the next day, in the next week, in the next month for price action.”
By learning to interpret this data through technical analysis, time counts, and pattern recognition, traders can shift from guessing to operating on probabilities. The current pullback, while unsettling for some, is a healthy process of removing froth from an overextended market. For the prepared trader, this volatility creates opportunity. By identifying key support levels and watching for the next high-probability setup, one can navigate this environment with discipline and confidence.
Trading involves substantial risk. All content is for educational purposes only and should not be considered financial advice or recommendations to buy or sell any asset. Read full terms of service.