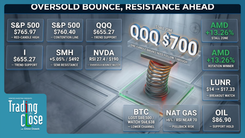
Trading The Close Market Recap - 11/11/2026: Tech-Led Breakouts Amid Bond Market Absence and Dollar Surge

Tech Stocks Rally Into Resistance as Traders Watch for Breakout Confirmation
Trading the Close Market Review | November 11, 2026
Technology stocks led a strong move higher on Wednesday, with semiconductors pushing through near-term resistance and the broader market recovering important technical ground. For Verified Investing Pro Trader Drew Dosek, the session provided encouraging signs for the bulls, but several major charts still need confirmation before the next leg higher becomes more convincing.
The timing added another consideration. The bond market was closed for Veterans Day, leaving equities to trade without normal Treasury market activity. That created an unusual backdrop for a rally already approaching important resistance levels. With fixed-income trading scheduled to resume Thursday, traders will have another opportunity to assess whether buyers can maintain control.
On Wednesday's Trading the Close, Drew focused on the structure behind the rally, the resistance levels that could slow momentum, and the importance of protecting gains after sharp advances. His broader message was straightforward: a strong move deserves attention, but traders still need to respect the next level on the chart.
S&P 500 Rally Faces a Key Resistance Test After Veterans Day
The S&P 500 began the session with a gap higher, clearing an inclining trend line that had previously marked the upper boundary of a parallel channel. That was a constructive development for the bulls, particularly after the recent period of selling and consolidation.
The advance eventually reached a significant pivot area dating back to June. This level has served as both support and resistance, making it an important reference point for traders evaluating whether the market can extend its recovery.
The index finished below that resistance area, leaving the breakout attempt incomplete. A sustained move above the pivot would strengthen the bullish setup and bring the next overhead resistance zone into focus. Another rejection would suggest the market still needs additional consolidation before attempting a more durable advance.
Drew also addressed the structure of the recovery. The recent price action has developed more aggressively than the gradual upward drift typically associated with a bear flag. He characterized the setup as inside-bar price action, with buyers attempting to reclaim the upper portion of the recent trading range.
The reopening of the bond market on Thursday adds another variable. Treasury yields and broader institutional participation could influence whether Wednesday's momentum carries forward. The technical question remains whether buyers can hold the ground recovered during the rally.
Nasdaq 100 and Semiconductor Stocks Lead the Technology Breakout
The strongest evidence of renewed buying interest came from the Nasdaq 100 and semiconductor stocks. Both moved higher, although their charts present different technical considerations heading into the next session.
The Invesco QQQ Trust (QQQ) reclaimed the upper portion of a large daily selling candle from November 5. Closing above that candle was a constructive first step because it showed buyers recovering territory previously controlled by sellers.
Drew wants to see additional confirmation. Another daily close above Wednesday's candle would strengthen the case that the recovery has room to continue. The next major area to monitor is a consolidation zone containing several historical pivots.
The VanEck Semiconductor ETF (SMH) delivered an even stronger move. After recording two consecutive closes above an inclining trend line, the ETF gapped over nearby resistance and advanced sharply.
That sequence matters because it demonstrates how a successful breakout can change the technical picture. Once price clears an established resistance area, there may be fewer immediate obstacles until the next cluster of sellers comes into view.
SMH is now approaching another significant overhead resistance zone. Following such a rapid advance, Drew sees the possibility of consolidation as traders reassess positions and some participants lock in gains.
The sector's ability to hold above its recently reclaimed levels will be an important indication of whether the breakout is developing into a sustained move or simply a sharp recovery within a larger trading range.
AMD and Nvidia Highlight Changing Momentum in Semiconductor Stocks
Individual semiconductor names also showed how quickly momentum can shift within a leading sector.
Advanced Micro Devices (AMD) was a focus of Drew's analysis after a substantial advance from its recent lows. The move brought attention back to an inclining trend line that had previously been broken, creating a potential technical reclamation.
Reclaiming a broken trend line can improve a chart's near-term outlook, particularly when accompanied by strong price action. However, the next test is whether the stock can remain above that level when the initial buying momentum slows.
The original market discussion also raised the possibility of capital rotating between AMD and Nvidia (NVDA). Relative strength between competing semiconductor companies can provide useful clues about where traders are concentrating their attention.
Still, a stronger move in AMD does not establish that institutional capital has directly shifted out of Nvidia. The more useful technical observation is that leadership within the sector can change, even when the broader semiconductor group is advancing.
For traders, those differences help identify which stocks are breaking resistance, which are approaching potential exhaustion areas, and where the risk-reward picture may be changing.
US Dollar Breakout Adds Pressure to Gold as Silver Holds Up
Away from equities, Drew highlighted a developing divergence between the US dollar and precious metals.
The US Dollar Index (DXY) advanced and moved through a resistance area that had previously rejected price. The chart also showed a constructive interaction with a parallel channel, supporting the possibility of additional upside if the breakout holds.
A stronger dollar can create a headwind for dollar-denominated commodities, although the relationship is not consistent in every session. Gold's weakness alongside dollar strength made that relationship particularly relevant to Wednesday's analysis.
Gold declined and slipped below its recent consolidation area. Drew identified a lower declining support trend line as a potential destination if the current support structure fails to hold.
That would represent a change in the near-term technical picture. Traders watching for a possible entry would need to evaluate whether price stabilizes at support or continues toward the lower trend line.
Silver, meanwhile, held up better than gold.
Its relative resilience was notable because silver has both monetary and industrial demand drivers. Demand connected to electronics, electrical infrastructure, and other industrial applications can influence its behavior differently from gold.
The divergence does not guarantee that silver will continue outperforming. It does suggest that traders should evaluate the two metals on their individual charts rather than assuming they will move together.
If the dollar continues higher, the ability of either metal to defend technical support will become increasingly important.
Bitcoin Tests Support as Buyers Challenge a Breakdown
Bitcoin offered another useful example of why Drew looks for confirmation around major technical levels.
After falling below an important support area during the previous session, Bitcoin attracted buying interest and moved back toward the broken level. The recovery raised questions about whether the initial breakdown would develop into a sustained decline.
Drew compared the behavior of support to a trampoline or spiderweb. When price moves into an established support area, that level can temporarily stretch under selling pressure before buyers respond.
The analogy helps explain why a brief move below support does not always lead to continued downside.
A single close beneath a trend line may be an early warning, but subsequent price action determines whether sellers can maintain control. If buyers reclaim the level and hold above it, the bearish setup becomes less convincing.
Conversely, another rejection near former support could reinforce the downside risk.
For Bitcoin traders, the next daily closes will provide more information about whether the recovery is gaining traction. The important lesson is to evaluate how price behaves after testing a level rather than assuming the initial break has settled the direction.
Natural Gas and Oil Show Why Resistance and Confirmation Matter
Energy markets provided two additional examples of how technical structures can influence trading decisions.
Natural gas had advanced through nine consecutive positive sessions before reaching the lower boundary of an inclining parallel channel established in February 2024.
That extended rally brought price into an area where sellers had a technical reason to become more active. The subsequent rejection illustrated the challenge of initiating a new position after a prolonged advance into established resistance.
Drew identified a lower confluence of inclining and declining trend lines as an area worth monitoring if natural gas continues pulling back. A move toward that zone could create a different technical setup, although traders would still need to assess price behavior and confirmation.
The lesson applies beyond natural gas. A strong trend can remain intact while the immediate entry becomes less attractive because price has already traveled a considerable distance from support.
Oil also struggled to maintain an intraday advance and moved back toward a previously important support area.
Drew noted that the prior session's doji candle and a time-based technical count left open the possibility of a near-term bounce. That potential recovery remains conditional on how price responds around support.
Neither setup requires traders to predict an exact turning point. Both demonstrate the value of identifying where a chart may offer a more favorable opportunity and waiting for price to confirm the idea.
Micron and Rumble Show the Importance of Taking Profits at Resistance
One of the most useful lessons from Wednesday's show came from the sharp advances in individual stocks.
Micron Technology (MU) had rallied significantly from a recent technical low, recovering after testing an important lower trend line. The advance carried price back toward a consolidation area and additional overhead resistance.
Drew used the move to discuss a common trading challenge: deciding when to take profits after a stock has already delivered a substantial gain.
A trader who entered near support may have a very different risk-reward picture once price reaches resistance. The original entry thesis may have worked, but that does not automatically make the current price an attractive place to continue holding the entire position.
Drew's reaction was direct:
"I'd be slamming that take profit button."
The point was about recognizing when a favorable move has reached an area where the probability of additional upside may become less attractive relative to the risk of a pullback.
Taking profits does not require calling the exact top. It reflects a willingness to act when price reaches a level identified in the trading plan.
Rumble (RUM) offered a similar example following a sharp post-earnings advance. The stock moved higher after reporting mixed results, with revenue exceeding expectations while earnings per share fell short.
That rally carried Rumble toward a consolidation area near the 38.2% Fibonacci retracement around $6.82, with $7 representing another nearby technical reference.
After a substantial single-session move, a period of consolidation would not be unusual. Traders would want to see whether the stock can absorb profit-taking and hold its gains before assuming another breakout is underway.
Both examples reinforce the same principle: the quality of a trade depends on the relationship between entry, risk, target, and current market structure. A strong move can create an opportunity to reassess exposure rather than automatically increase it.
What Traders Should Watch After the Technology Rally
The next session will help clarify whether Wednesday's strength marked the beginning of a broader advance or a recovery that still needs time to develop.
The first area to watch is the S&P 500's reaction around its major pivot resistance. A sustained move above that area would improve the technical outlook, while another rejection would keep the recent trading range relevant.
Technology leadership is the second consideration. QQQ needs to build on its recovery above the November 5 selling candle, while SMH faces a fresh test as it approaches overhead resistance following its sharp advance.
The third consideration is the dollar. Continued strength could influence precious metals and other dollar-sensitive assets, making the divergence between gold and silver worth following.
Bitcoin and energy markets provide additional examples of the same decision-making framework. Support and resistance levels establish the areas of interest, while subsequent price action helps determine whether those levels are holding or failing.
With Treasury trading returning Thursday, traders will also have a clearer view of how the equity rally responds to changes in yields and broader market participation.
Bottom Line: Strong Breakouts Still Need Follow-Through
Wednesday's rally improved the technical picture across several important equity charts, particularly in technology and semiconductors. Buyers reclaimed resistance, momentum strengthened, and several stocks recovered meaningful ground.
Drew's analysis also identified where that strength could face its next challenge. The S&P 500 remains near a major pivot, semiconductor stocks are approaching overhead supply, and the dollar's advance introduces another consideration for commodity traders.
The practical takeaway is to respect both sides of the chart. Breakouts can create room for additional upside, but resistance remains relevant, especially after rapid advances.
For traders already holding profitable positions, the approach into resistance may be an opportunity to reassess risk. For those considering new entries, confirmation and location remain important.
The next move will provide more information. The levels are already on the chart.
This article is for educational and informational purposes only and does not constitute financial advice. Technical analysis involves uncertainty, and past price behavior does not guarantee future results.
Trading involves substantial risk. All content is for educational purposes only and should not be considered financial advice or recommendations to buy or sell any asset. Read full terms of service.