Bitcoin's Critical Juncture: Bull Flag vs. Market Correlation Risks
By Gareth Soloway, Chief Market Strategist at VerifiedInvesting.com - May 17th, 2025
If you've been watching Bitcoin's price action lately, you've likely noticed we're at a fascinating inflection point. The leading cryptocurrency has been coiling within a textbook bull flag pattern over the past two weeks, suggesting a potential continuation of its recent uptrend. However, as I always emphasize to our members at VerifiedInvesting.com, no technical setup exists in a vacuum – and Bitcoin's increasingly tight correlation with equities adds an important layer to our analysis.
The Big Picture: Key Support and Resistance Levels
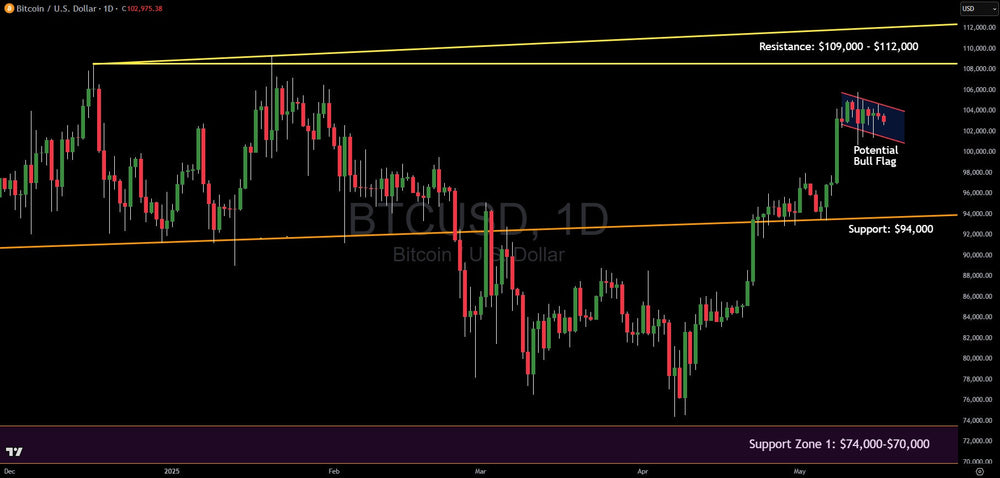
Let's start by zooming out and examining the critical structural elements on Bitcoin's daily chart. What immediately jumps out is the well-defined resistance zone between $109,000 and $112,000. This resistance isn't arbitrary – it's formed by the intersection of a horizontal ceiling that has capped previous rally attempts and a long-term ascending trendline. This convergence creates a particularly formidable barrier that will require significant buying pressure to overcome.
On the support side, we have two crucial levels to monitor. First, there's the ascending support trendline currently sitting around $94,000. This dynamic support has proven its significance repeatedly, with multiple touches validating its importance as a floor for Bitcoin prices. Think of this as Bitcoin's primary safety net in the event of a pullback.
Should that primary support fail, we have a more substantial safety zone between $74,000 and $70,000. This area represents our ultimate line in the sand – a zone where I'd expect substantial institutional buying interest to emerge. It's worth noting that this lower support coincided with Bitcoin's April low, a timing that brings us to another critical aspect of our analysis.
The Stock Market Correlation: A Double-Edged Sword
Here's something that warrants our close attention: Bitcoin's April low perfectly coincided with the stock market bottom. Since then, both assets have rallied sharply in tandem. This is no coincidence – it's a clear illustration of the strengthening correlation between Bitcoin and traditional equities.
While this correlation has been beneficial during the recent rally, it's also a potential risk factor we can't ignore. If the stock market experiences a pullback (and markets rarely move in a straight line), Bitcoin could follow suit regardless of its own technical setup. This is precisely why understanding multiple timeframes and having clearly defined risk parameters is so crucial in today's interconnected markets.
The Near-Term Bull Flag: A Pattern Worth Watching
Now, let's focus on what's happening right now – the potential bull flag pattern that's formed over the past two weeks, beautifully defined by those parallel pink lines on our chart. For those less familiar with this pattern, a bull flag typically forms after a strong upward move (the "flagpole") when price consolidates in a slight downward channel (the "flag").
What makes this pattern particularly interesting is its location – forming just below the significant $109,000-$112,000 resistance zone. This suggests the recent consolidation may be a pause to gather strength before attempting to challenge that overhead resistance.
The price action within the flag has been textbook so far: lower highs and lower lows, but with diminishing selling pressure and tightening price action. Notice how the candles have become more compressed as we've progressed through the pattern? This compression often precedes a resolution – like a spring coiling tighter before release.
Bitcoin is currently trading around $102,975, roughly in the middle of this flag pattern. What I'm watching for now is the direction of the eventual breakout. A decisive move above the upper pink trendline would confirm the bullish bias and potentially set up a test of the major resistance zone. Conversely, a breakdown below the flag could signal a retest of that $94,000 support.
Trading Implications and Risk Management
So what does this mean for traders and investors? If you're considering a long position, the bull flag offers a clearly defined setup. A breakout above the upper boundary of the flag (currently around $105,000) would be the traditional entry trigger, with an initial target at the resistance zone between $109,000-$112,000.
However, given the aforementioned stock market correlation risk, I'd advise more conservative position sizing than you might normally employ. The relationship between Bitcoin and equities adds a layer of external risk that pure technical analysis can't fully account for.
For those already in long positions from lower levels, this is an excellent time to review your risk parameters. Consider moving stops up to protect gains, perhaps to just below the lower boundary of the flag pattern or even to the $94,000 support level depending on your risk tolerance and time horizon.
If you're more conservative or bearish on the broader market, waiting for confirmation is the prudent approach. A successful breakout and retest of the flag's upper boundary would provide a higher-probability entry with a clearly defined risk.
What Could Invalidate This Analysis?
As always, I believe in acknowledging what would prove my analysis wrong. In this case, a decisive daily close below $94,000 would invalidate the near-term bullish bias and potentially signal a deeper correction toward the $74,000-$70,000 support zone.
Additionally, significant weakness in the stock market could override Bitcoin's technical setup, regardless of how textbook the bull flag appears. This is why I always emphasize monitoring correlations and not analyzing any asset in isolation.
Conclusion: Balanced Optimism with Eyes Wide Open
The current technical setup for Bitcoin leans cautiously bullish in the near term, with the bull flag pattern suggesting the potential for continued upside. However, the proximity to major resistance and the stock market correlation risk tempers my enthusiasm somewhat.
What we're likely facing is a "decision point" for Bitcoin – whether it gathers enough momentum to challenge that formidable $109,000-$112,000 resistance zone, or whether broader market pressures force a retest of support levels.
For now, my approach remains balanced: respect the bullish pattern that's forming, but maintain strict risk management knowing that Bitcoin doesn't exist in a technical vacuum. This is precisely the type of market environment where emotional discipline trumps prediction – a principle I've seen proven countless times over my 26 years of trading.
Keep your eye on that bull flag resolution – it could set the tone for Bitcoin's next major move. And as always, trade the probabilities, not your hopes or fears.
Stay tuned for more updates and educational content from us at VerifiedInvesting.com, where we turn chart analysis into actionable trading opportunities.
Trading involves substantial risk. All content is for educational purposes only and should not be considered financial advice or recommendations to buy or sell any asset. Read full terms of service.


