Ethereum Analysis: Charts And Market Conditions
As we move deeper into late May 2025, Ethereum finds itself in one of those pivotal moments that every technical analyst lives for – the kind of setup where the charts are practically screaming at us about what's coming next. After watching ETH climb from the depths of despair in early 2024 to a more respectable position today, we're now staring at a technical formation that could very well determine whether the altcoin party continues or if we're about to see another reality check.
Let me walk you through what I'm seeing on this daily ETH/USD chart, because frankly, it's a textbook example of how markets create these beautiful, yet nerve-wracking decision points.
The Big Picture: Why Ethereum Is Fighting an Uphill Battle
Before we dive into the technical nitty-gritty, we need to address the elephant in the room – Ethereum and the broader altcoin market have been struggling to keep pace with Bitcoin's relentless march higher. While BTC has been making headlines and capturing institutional attention, ETH has been playing catch-up, and not particularly well at that.
What's even more telling is how closely altcoins have been tracking the traditional stock market. We've seen this correlation play out in real-time, and now that the stock market rally appears to be running out of steam, guess what's happening to our beloved altcoins? They're hitting the brakes too. It's like watching dominoes fall – when risk appetite wanes in traditional markets, crypto feels it first, and altcoins feel it hardest.
This broader context is crucial because it helps explain why Ethereum is butting its head against the technical ceiling I'm about to show you.
The Technical Setup: A Classic Squeeze Formation
Now, let's get to the meat and potatoes of this analysis. What we're looking at here is absolutely fascinating from a technical standpoint – Ethereum has painted itself into a corner, and that corner is getting tighter by the day.
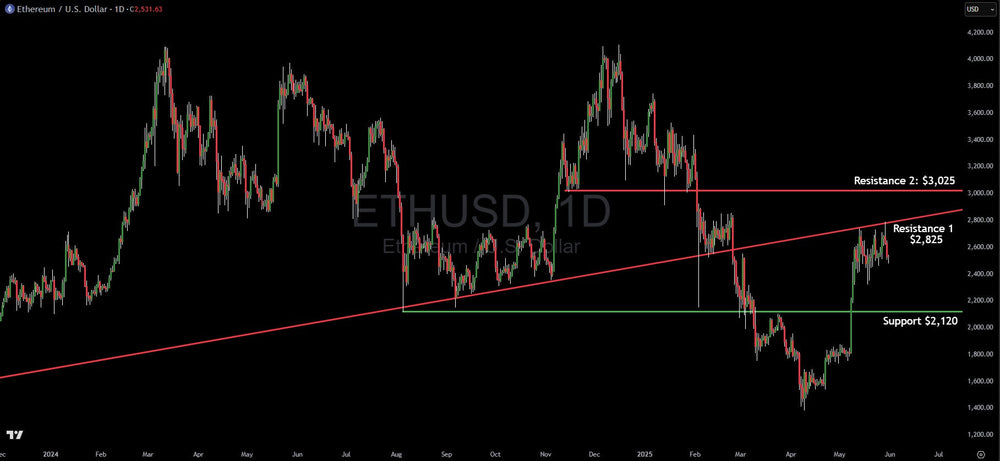
The star of this show is that beautiful descending resistance trendline sitting right at $2,825. This isn't just any random line I've drawn on the chart – this trendline has been acting like a brick wall for ETH, consistently rejecting any attempts to break higher. Every time Ethereum gets frisky and tries to push above this level, sellers step in and remind buyers who's really in charge.
But here's where it gets interesting. While that descending resistance has been capping upside moves, we've got rock-solid support sitting down at $2,120. This horizontal support level has proven itself time and again, acting like a reliable floor that buyers defend with conviction. It's one of those levels that makes you sit up and take notice – the kind of support that doesn't give up without a real fight.
So what do we have? Ethereum is essentially caught between these two forces – a descending ceiling and a horizontal floor. In technical analysis, we call this a converging pattern, and it's like watching a coiled spring. The longer price gets squeezed between these levels, the more explosive the eventual breakout tends to be.
The Road We've Traveled
To truly appreciate where we are today, we need to acknowledge the journey Ethereum has taken. Remember those heady days when ETH was flirting with the $4,000+ level? Those seem like a distant memory now, don't they? The subsequent crash that took us down to the $1,400-$1,500 range was brutal – the kind of decline that separates the wheat from the chaff in this market.
But here's what I find encouraging: Ethereum didn't just collapse and stay down. Instead, it's been methodically working its way back up, building a foundation of higher lows and showing us that there's still life in this market. The recovery from those lows to our current position around $2,531 represents a significant achievement, even if it doesn't feel like it when you're watching Bitcoin steal all the thunder.
The April Rally and Its Current Stall
The recent rally that began in early April was impressive – no question about it. Altcoins, including Ethereum, caught fire and reminded everyone why they fell in love with this space in the first place. But here's the thing about rallies in volatile markets: they don't go up in straight lines forever, and what goes up fast can come down just as quickly.
What strikes me about the current setup is how perfectly it aligns with the broader market sentiment shift. Just as traditional markets started showing signs of fatigue, so too did our altcoin momentum. It's as if the market is taking a collective breath, trying to decide whether this recent strength was the real deal or just another false dawn.
The Critical Levels That Matter Most
Let's talk about what really matters for anyone considering a position in ETH right now. That resistance level at $2,825 isn't just a line on a chart – it's a psychological battleground. If Ethereum can finally break above this descending trendline with conviction, it opens the door to the next major resistance zone at $3,025. A move above $3,025 would represent a significant shift in character and could trigger renewed interest from momentum traders who've been sitting on the sidelines.
On the flip side, that support at $2,120 is absolutely critical. A breakdown below this level would be more than just technically significant – it would represent a failure of the recent recovery narrative and could trigger a much deeper correction. In my experience, when horizontal support levels like this give way, the selling can accelerate quickly as stop-losses get triggered and confidence evaporates.
What the Charts Are Really Telling Us
Here's what 26 years of studying charts has taught me: patterns like this don't resolve quietly. When you've got a market squeezed between converging levels like this, the eventual breakout tends to be decisive. The question isn't whether Ethereum will break out of this pattern – it's which direction it will choose and how violent that move will be.
The volume characteristics we've been seeing lately suggests that institutional interest might be waning slightly, which could favor a breakdown rather than a breakout. However, and this is important, crypto markets have a habit of surprising everyone just when conventional wisdom seems most certain.
Potential Scenarios and What to Watch For
If you're considering a trade here, you need to be prepared for both scenarios. A breakout above $2,825 with strong volume could target that $3,025 resistance, and potentially much higher if momentum really builds. But remember, any bullish move needs to happen in conjunction with Bitcoin showing renewed strength – ETH rarely leads in this market.
Conversely, a breakdown below $2,120 could see Ethereum retest those lower levels we saw earlier in its recovery phase. The speed of any such decline would likely depend on how quickly the broader market shifts sentiment.
The Bottom Line
Ethereum sits at a critical juncture, trapped between technical levels that will likely determine its path for the coming weeks, if not months. The convergence of the descending resistance and horizontal support creates a pressure cooker environment where the eventual resolution should be explosive in one direction or the other.
What concerns me most is the broader context – with stock markets showing signs of fatigue and Bitcoin's dominance remaining elevated, altcoins like Ethereum faces headwinds that go beyond just technical analysis. Sometimes the best trade is no trade, and right now, waiting for a clear resolution of this pattern might be the wisest approach.
The next few trading sessions will be absolutely crucial. Watch that $2,825 resistance like a hawk – if it breaks with authority, we could see a renewed surge in altcoin interest. But if it holds and we start seeing selling pressure build, that $2,120 support becomes the line in the sand between recovery and disappointment.
In markets like these, patience isn't just a virtue – it's a necessity.


