DXY Retracing A Major Breakdown, Further Downside Likely
Article Summary: The U.S. Dollar (DXY) recently broke major support, after being stuck in a wedge pattern since 2021. The breakdown likely signals the strength of the Dollar is now waning. While the DXY may continue to bounce in the near-term, downside is the higher probability over the mid-term to long-term. This also raises significant questions about the Dollar's long-term dominance as the reserve currency of the world.
-----------------------------------------------------------------------------------------------
Dollar Index Breakdown: Critical Technical Levels Signal Major Directional Shift
The U.S. Dollar Index (DXY) has reached a pivotal technical juncture that demands the attention of currency traders, global investors, and anyone with exposure to international markets. After carving out a massive multi-year symmetrical triangle pattern, the greenback has finally shown its hand with a decisive breakdown below long-term support. Let's unpack what this significant technical development means and where the dollar might be headed next.
The Multi-Year Triangle: Setting the Stage
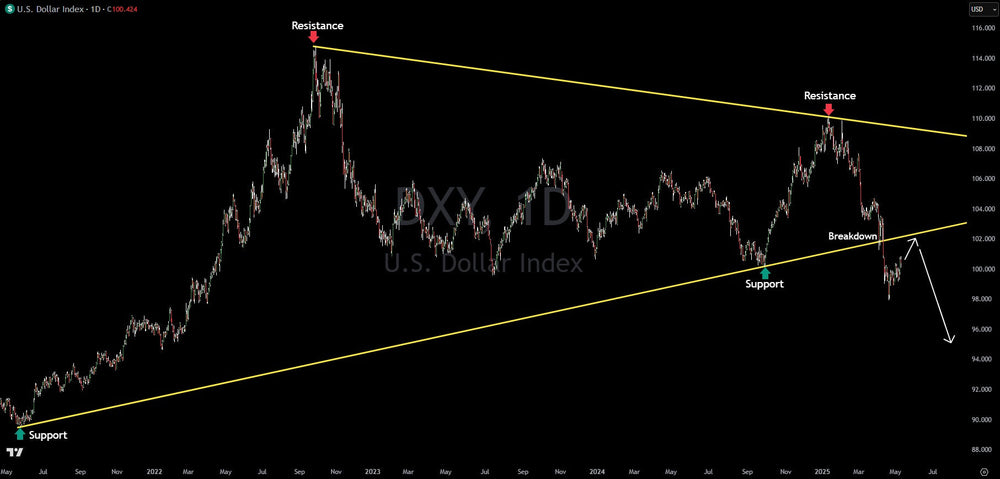
When I look at this chart, I'm immediately struck by the clarity of the pattern that's been developing since 2021. The dollar has been compressing within a symmetrical triangle (or wedge) formation, bouncing between two converging trendlines with remarkable precision. This type of consolidation pattern often represents a period of equilibrium between buyers and sellers before an eventual breakout signals which side has gained the upper hand.
What makes this particular triangle so significant is both its duration and the fact that it follows a substantial uptrend that began around 2021. The pattern has been forming for approximately three years – not days or weeks – making the resolution of this pattern all the more consequential for global markets.
Anatomy of the Breakdown
The most critical development on this chart is the recent breakdown below the ascending support trendline. This yellow line connecting the major lows since 2021 had served as a reliable floor, with the market respecting this boundary on multiple touches. Each time the dollar approached this trendline, buyers stepped in confidently – until now.
What we're seeing isn't just a minor breach but what appears to be a decisive breakdown below this critical support. The market didn't just dip below the line; it has shown follow-through selling pressure, confirming that this isn't likely a false break or bear trap.
The current price of 100.424 (down 0.21%) places the index well below this former support line – a telling sign that the market structure has fundamentally changed. When such a well-established trendline gives way after years of holding firm, it typically signals a meaningful shift in the underlying supply-demand dynamics.
The "Scene of the Crime" Retracement Opportunity
Now, here's where things get particularly interesting for active traders. Notice the small upward-pointing arrow on the chart? This indicates the high probability of what we often call a "return to the scene of the crime" – a retracement back to test the broken trendline from below.
This is one of the most reliable patterns in technical analysis. Former support, once broken, often transforms into new resistance. It's almost as if the market needs to "check its work" by revisiting the breakdown point to confirm its significance before continuing its new trajectory.
For traders, this potential retracement offers both an opportunity and a warning. If you missed shorting the initial breakdown, this retest could provide a second-chance entry with a clearly defined risk level. Conversely, if you're holding long dollar positions, this retracement might offer a more favorable exit point before further declines materialize.
The psychology behind these retests is fascinating – it represents the last stand of the bulls who are trying to defend what was once a significant support level. But in my experience, these retests rarely result in a full recovery above the broken trendline. Instead, they typically confirm the new resistance and set the stage for the next leg down.
Projecting the Downside Target
The longer-term implications of this breakdown are illustrated by the larger downward-pointing arrow on the chart. In triangle breakdowns like this, we often see the price eventually travel a distance equivalent to the widest part of the pattern. In this case, that suggests a substantial downside target that could see the dollar index potentially drop toward the 94-96 range.
Such a move would represent a significant devaluation of the greenback from current levels and would have far-reaching implications across global markets – potentially boosting commodities priced in dollars, providing relief for emerging markets with dollar-denominated debt, and creating tailwinds for multinational companies with significant overseas revenue.
The path lower is unlikely to be straight, of course. Markets rarely move in straight lines, and countertrend bounces are to be expected. However, the overall technical structure now favors the bears until proven otherwise.
Volume Considerations and Confirmation Signals
While not explicitly marked on this chart, volume behavior around a breakdown of this magnitude is crucial to monitor. Increased volume during the breakdown would add considerable weight to the bearish case, as it would indicate strong conviction behind the selling pressure.
Similarly, if volume is notably light during any retracement back to the broken trendline, that would support the "retest and fail" scenario we're anticipating. Conversely, unusually high volume on a retracement accompanied by strong price action back above the broken trendline would be a warning sign that the breakdown might be a false move.
Trading Implications and Strategy Considerations
For traders looking to position around this technical development, several approaches merit consideration:
- Breakout Confirmation Strategy: For those who haven't yet established positions, waiting for the retracement to the broken trendline (around the 102 level) and then entering short positions if resistance holds could offer an optimal risk-reward setup.
- Scale-In Approach: Given the magnitude of the potential move, scaling into a position on both the current price action and on any retracements could help manage the inevitable volatility.
- Options Strategies: For those preferring defined risk, put options or put spreads on dollar-based ETFs could provide exposure to further downside while capping potential losses if the breakdown fails.
- Correlated Assets: Rather than trading the dollar directly, consider positioning in assets that typically benefit from dollar weakness – gold, silver, euro currency pairs, or emerging market equities could all see tailwinds from continued dollar depreciation.
Risk Factors and Invalidation Scenarios
No technical setup is without risk, and several scenarios could invalidate this bearish outlook:
The most immediate risk is a strong recovery back above the broken support trendline, especially if maintained for several days with strong closing prices. This would suggest the breakdown was a false move and could trigger a significant short squeeze.
External factors such as a flight to safety during market turbulence, unexpected hawkish shifts in Federal Reserve policy, or geopolitical developments could strengthen the dollar despite the bearish technical picture.
Additionally, if the retracement back to the broken trendline fails to materialize and price instead accelerates lower too quickly, it could indicate an over-stretched move prone to a sharper bounce than anticipated.
Conclusion: The Dollar at a Crossroads
The technical breakdown in the U.S. Dollar Index represents a potential sea change in the currency markets after years of consolidation. The pattern is clear, the breakdown is significant, and the projected path suggests considerably more downside after a potential retracement to test the broken support.
For investors and traders alike, this development warrants close attention, as dollar movements ripple through virtually every asset class in global markets. Whether you're positioning directly in currency markets or managing exposure in your broader portfolio, the technical signals on this chart suggest we're entering a new phase for the world's reserve currency.
As always, combining these technical signals with broader macroeconomic analysis and risk management principles will be essential. But from a purely technical perspective, the verdict seems clear: the dollar's path of least resistance has shifted downward, and significant repricing may be underway.
What we're witnessing isn't just another routine fluctuation, but potentially the start of a major directional shift that could define currency markets for months to come. Stay vigilant, manage risk carefully, and consider how dollar weakness might create both challenges and opportunities across your broader investment landscape.
Written by Chief Market Strategist Gareth Soloway at VerifiedInvesting.com
This article is intended for informational and educational purposes only and does not constitute financial advice. All trading involves risk. Past performance is not indicative of future results. Trading involves substantial risk. All content is for educational purposes only and should not be considered financial advice or recommendations to buy or sell any asset. Read full terms of service.
Trading involves substantial risk. All content is for educational purposes only and should not be considered financial advice or recommendations to buy or sell any asset. Read full terms of service.