
10 Year Yield Head And Shoulders Signals Coming Major Drop
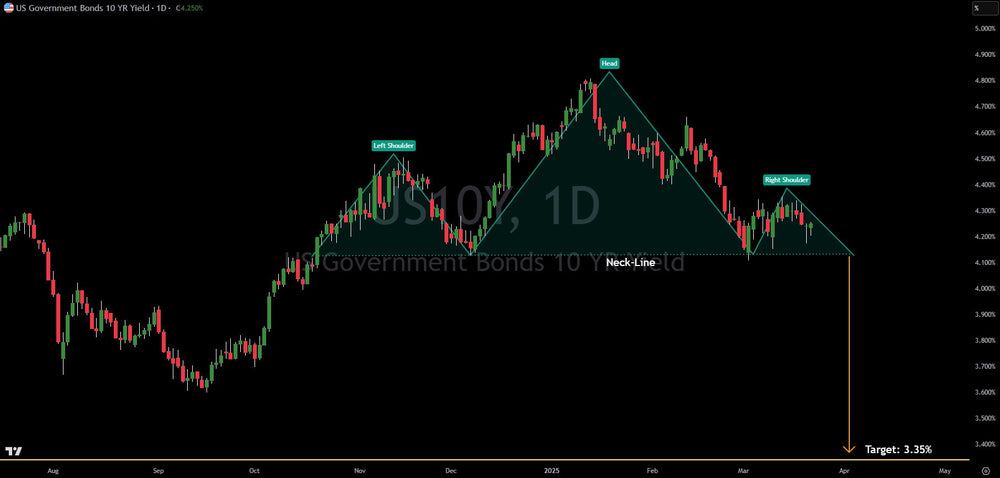
The 10-year Treasury yield is exhibiting a classic head and shoulders pattern on the daily chart, a formation widely recognized for its bearish implications. This pattern, characterized by a peak (left shoulder), a higher peak (head), and another peak roughly equal to the first (right shoulder), suggests a potential shift in market sentiment towards lower yields.
Crucially, the bearish signal is currently unconfirmed. The pattern becomes active only when the price breaks below the neckline, which is the support level connecting the troughs between the shoulders and the head. As of now, this neckline remains intact. Therefore, while the formation is present and warrants attention, a significant downward move is not yet highly likely.
However, if the neckline is breached, the technical target for the 10-year yield points towards a substantial decline, potentially reaching 3.35%. This would represent a drop of approximately 90 basis points from current levels. Such a significant decrease in yields often reflects increased demand for safe-haven assets like Treasury bonds, typically driven by concerns about economic growth.
The potential trigger of this pattern and the subsequent drop in yields could indeed signal a looming recession in the United States. Several underlying factors could contribute to this scenario. A dramatic slowdown in consumer spending has started, which is a critical driver of economic growth. In addition, U.S. government employees are being fired due to cuts linked to Elon Musk's DOGE. Lower government spending and a decrease in the workforce are two major factors that can contribute to a recession.
In conclusion, the technical picture for the 10-year Treasury yield suggests a bearish outlook, contingent on the confirmation of the head and shoulders pattern. Investors and traders should closely monitor the neckline. A break below this key level could unleash significant downside pressure on yields and potentially serve as a warning sign for the broader U.S. economy.
This article is intended for informational and educational purposes only and does not constitute financial advice. All trading involves risk. Past performance is not indicative of future results. Trading involves substantial risk. All content is for educational purposes only and should not be considered financial advice or recommendations to buy or sell any asset.
Trading involves substantial risk. All content is for educational purposes only and should not be considered financial advice or recommendations to buy or sell any asset. Read full terms of service.


