
Apple (AAPL): Chart Signals Near-Term Upside Before Major Short Trade
By Gareth Soloway, Chief Market Strategist at VerifiedInvesting.com - May 17th, 2025
Article Summary: AAPL's bullish consolidation pattern signals a likely move higher, but once it hits $224 resistance, watch for a reversal! This rare two-phase setup offers traders the chance to potentially profit on BOTH the upside and subsequent pullback. Are you positioned to capitalize?
-----------------------------------------------------------------------------------------------
The recent price action in Apple Inc. (AAPL) presents a fascinating technical setup that's caught my attention. After experiencing significant volatility over the past few months, AAPL has entered what appears to be a critical juncture that signals a two-phase opportunity for traders. First, we're seeing signs of continued upside potential in the near term, followed by a compelling shorting opportunity once price reaches key resistance. Let's dive into what the charts are telling us, and more importantly, how traders can capitalize on both moves.
Bullish Consolidation Signals Near-Term Strength
What makes this current price action particularly interesting is the development of a tight trading range – a bullish consolidation pattern that's been forming over the past couple of weeks. This type of price behavior often signals a period of equilibrium where buyers and sellers are temporarily in balance, but more importantly, the bullish nature of this consolidation strongly suggests that the next move is likely to be higher.
The consolidation we're seeing has all the hallmarks of accumulation. Notice the tight price ranges with relatively controlled pullbacks – this shows us that buyers are stepping in consistently, preventing significant downside moves. When we see this type of behavior after a recovery from lows, it typically signals continued upward momentum once the consolidation resolves.
Based on this pattern, I expect Apple to break out of this consolidation to the upside, potentially making a run toward the major resistance level we're about to discuss. This gives traders a potential opportunity to capture the upcoming move higher before we reach our key resistance zone.
The $224 Major Resistance Level – A Critical Ceiling
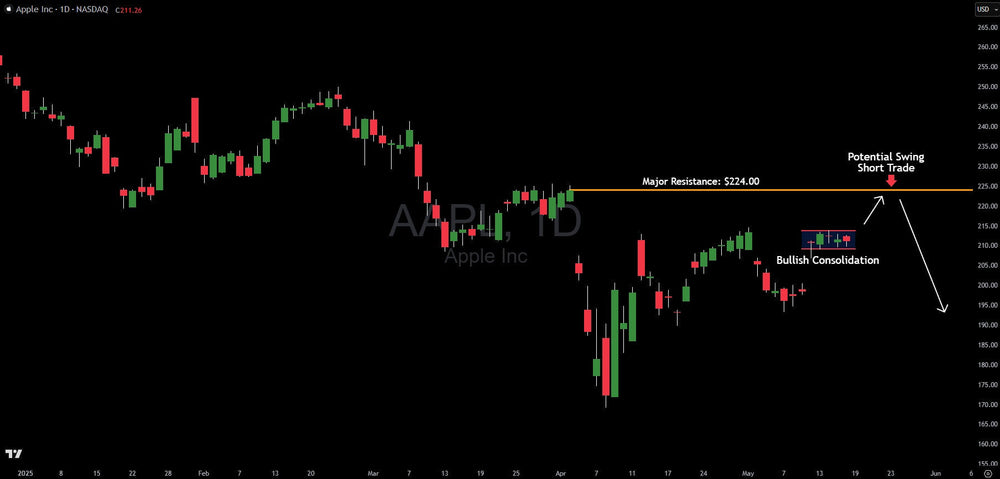
Take a look at that orange horizontal line at $224.00 on our chart. This isn't just any resistance level – it represents a significant barrier that has historical importance in Apple's trading pattern. Major resistance levels like this one don't form by accident. They represent price zones where selling pressure has previously overwhelmed buying interest, creating a psychological ceiling that can be difficult to breach.
What makes the $224 level particularly compelling is how it relates to Apple's previous price structure. Earlier this year, we saw AAPL trade near these levels before a substantial decline materialized. Markets have memory, and institutional traders often use these key levels to make decisions about positioning.
The Two-Phase Trading Opportunity
Now, let's connect these critical elements to understand the complete trading opportunity before us. The bullish consolidation pattern we're seeing strongly suggests that Apple will move higher in the near term. This gives traders a chance to catch this upward momentum with an excellent risk-reward profile – entering near current levels with a stop below the consolidation range.
However, as price approaches that significant $224 resistance level, the dynamics are likely to shift dramatically. This is where the second phase of our trading opportunity emerges – a potential swing short trade. The white bidirectional arrows on our chart visualize this perfectly: a move up to test resistance followed by a potential decline.
What makes this dual-opportunity so compelling is that we can use technical analysis to capitalize on both moves. First riding the bullish consolidation breakout higher, then potentially reversing position as price reaches major resistance. This is how professional traders often approach these setups – not forcing a single directional bias, but instead following what the chart is telling them at each critical juncture.
The Potential Swing Short Trade at $224
Given this technical landscape, while we expect near-term upside first, the truly compelling opportunity emerges once Apple reaches that $224 resistance level. At this point, we'll likely see a rejection at this technical ceiling. The resistance level represents a natural area where sellers are likely to reassert control, potentially triggering a meaningful reversal.
This isn't just theoretical – look at the price structure on the chart. The white bidirectional arrows visualize the complete price path: a move up to test resistance followed by a decline. This is classic technical analysis at work – markets often rally to test significant resistance levels before reversing course.
What makes this setup particularly attractive is the defined risk parameters it offers for the short trade. With clear resistance established at $224, traders can establish precise stop-loss levels just above this price, creating a favorable risk-reward scenario for a short position once the stock has completed its upward move.
Psychological Factors at Play
It's worth considering the psychological elements at work here. Apple, being one of the market's most widely held and followed stocks, often experiences heightened emotional trading around key technical levels. The bullish consolidation we're seeing suggests optimism among buyers, but this optimism will be tested severely at the $224 resistance.
Often, the most powerful reversals occur precisely when optimism is highest – when buyers have pushed a stock up to resistance and are confident of a breakout. This is when smart money frequently takes the other side of the trade. Remember, markets are designed to inflict maximum pain on the maximum number of participants, and shorting at resistance after a period of consolidation often aligns with this market truth.
Actionable Trading Strategy
For traders looking to capitalize on this two-phase opportunity, here's my approach:
- Near-Term Bullish Play: Consider entering long positions near current levels ($211.26) with stops just below the consolidation range. The bullish consolidation pattern suggests potential for an upside move toward the $224 resistance level, offering a favorable risk-reward setup.
- Prepare for the Reversal: As price approaches the $224 resistance level, begin preparing for the swing short opportunity. This means taking profits on long positions and watching for reversal signals.
- Short Entry Confirmation: Once price reaches the vicinity of $224, watch for candlestick patterns that suggest rejection – bearish engulfing patterns, shooting stars, or dojis would all strengthen the case for a short entry.
- Risk Management for Short Position: If entering a short position near $224, place stops just above this resistance level – perhaps at $226-227 to allow for some natural price volatility and avoid getting stopped out prematurely.
- Target Levels for Short Trade: Based on the chart structure, a return to the bottom of the current consolidation range would be a reasonable first target, with potential for further downside if broader market conditions deteriorate.
Alternative Scenarios to Consider
While I'm seeing the potential for a swing short opportunity here, it's important to acknowledge alternative scenarios. If Apple were to convincingly break above the $224 resistance level on strong volume, this would invalidate the short thesis and potentially signal a more significant upside move.
Markets rarely move in straight lines, and Apple's technical picture could evolve. This is why adaptive trading based on confirmation is so crucial. The presence of a clear resistance level gives us a well-defined point to assess whether our analysis remains valid.
Conclusion: A Two-Phase Trading Opportunity
What we're seeing in Apple's chart is a perfect example of how technical analysis allows us to make probability-based trading decisions with multiple opportunities in the same setup. The bullish consolidation pattern suggests near-term strength, giving us our first potential profitable trade as price likely moves toward the $224 resistance. Then, once at resistance, we have a second opportunity to profit from the probable rejection and decline.
This type of analysis removes emotion from the equation and focuses on what the price action is actually telling us. Rather than trying to predict exactly what Apple will do over extended periods, we're identifying high-probability scenarios in sequence and defining precise entry, exit, and risk management levels for each phase.
As we monitor Apple's price action in the coming days and weeks, the key will be watching first for the breakout from consolidation (likely higher), and then how it interacts with that critical $224 resistance level. Remember, successful trading isn't about being right every time – it's about finding setups where the probabilities favor your position and where risk can be clearly defined and managed.
The current Apple setup offers exactly that kind of opportunity – a chance to potentially profit from both the near-term strength and the subsequent reversal at resistance. This is the essence of adaptive, probability-based trading.
This article is intended for informational and educational purposes only and does not constitute financial advice. All trading involves risk. Past performance is not indicative of future results. Trading involves substantial risk. All content is for educational purposes only and should not be considered financial advice or recommendations to buy or sell any asset.
Trading involves substantial risk. All content is for educational purposes only and should not be considered financial advice or recommendations to buy or sell any asset. Read full terms of service.


