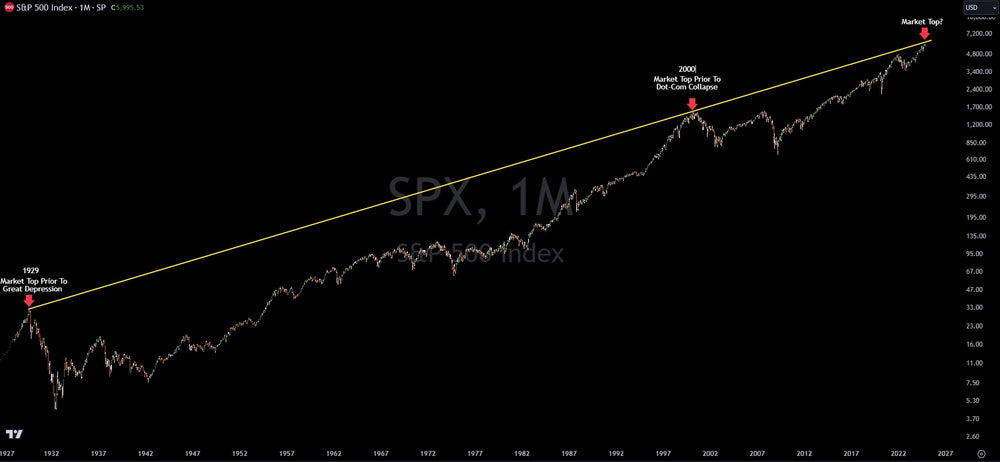
Is The S&P About To Hit A Trend Line That Goes Back To 1929?

The S&P 500 has hit 6,000. It took 1 year for the S&P 500 to go form 5,000 to 6,000. Interestingly enough, it took 3 years for the S&P to go from 4,000 to 5,000.
As markets rejoice over the probability of lower government regulation and taxes, the chart of the S&P 500 looks ominous. With valuations near all-time highs for stocks, investors are piling into the market without a care in the world. That may be a mistake.
When looking at the logarithmic chart of the S&P 500, there is a trend line that goes back to 1929, just before the stock market crashed and the Great Depression hit. When that trend line is connected to the Dot-Com high in 2000 and extended out, investors can see the S&P 500 is almost hitting it now. In fact, there could be less than 2% upside left in the stock market before that major trend line is hit.
Why should investors care about this trend line?
This trend line has marked the top of two of the greatest bubbles in U.S. history. Investors would not be out of line for thinking the trend line could be ready to mark the third...
Stay alert investors, economic metrics, narratives, hype...it is there to spin things into looking better than they are. Once the collapse comes, it could be nasty.
Trading involves substantial risk. All content is for educational purposes only and should not be considered financial advice or recommendations to buy or sell any asset. Read full terms of service.


