
NASDAQ Technical Analysis Using Logarithmic Chart
The NASDAQ has staged an impressive rally off the lows of August 5th. The tech index is now up 12.5% in less than a month.
Logarithmic charts are used by investors and traders when looking at long time frames. It helps make sense of of huge moves over long periods in price. Logarithmic charts look at percentage change over time vs. regular charts that look at Dollar change over time.
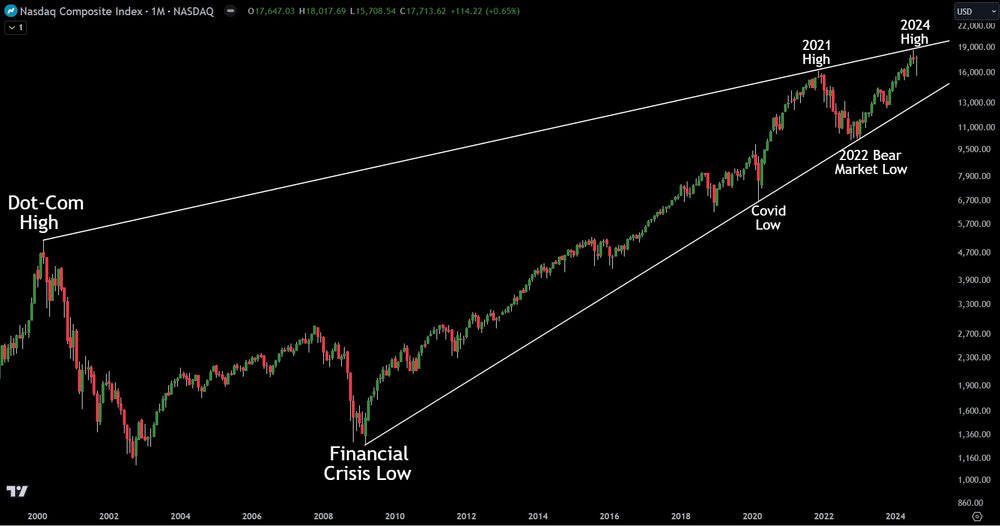
When looking at the NASDAQ chart since 2000, a logarithmic chart shows some remarkable things. Every pivot high going back to 2000 aligns perfectly. A trend line can be stretched from the dot-com high through each subsequent major pivot high. The same thing is found when looking at each major low going back to the financial crisis bottom. A trend line can be connected perfectly through that low, to the Covid low in 2020 to the bear market low in 2022.
This gives investors a major edge. Sell the high trend line hit and buy the low trend line hit.
Based on where the NASDAQ is currently at, investors should be more on the bearish side as it is only 7.5% away from the top trend line vs. 20.5% from the low trend line. In other words, reward favors the downside.
This article is intended for informational and educational purposes only and does not constitute financial advice. All trading involves risk. Past performance is not indicative of future results. Trading involves substantial risk. All content is for educational purposes only and should not be considered financial advice or recommendations to buy or sell any asset.
Trading involves substantial risk. All content is for educational purposes only and should not be considered financial advice or recommendations to buy or sell any asset. Read full terms of service.


