
S&P 500 Repeating Pattern From 2007 Before It Dropped 66%
History and chart analysis gives investors insights into future moves. Pattern recognition is a key part of technical analysis. Ultimately, good technical traders and investors can put probability heavily in their favor by analyzing data. This is what Verified Investing is all about.
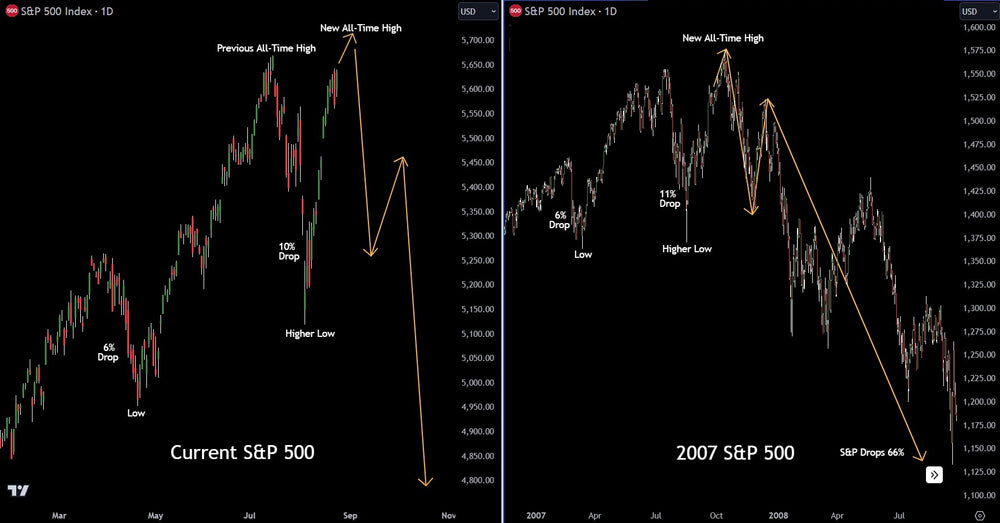
The S&P is putting in a pattern that is almost identical to the pattern formed back in 2007, before the financial crisis. In 2007, the stock market dropped by 11% before quickly recovering, just like it has done this time. In 2007, the S&P rallied up to make a slightly higher all-time high before collapsing 66% during the financial crisis.
This implies the S&P 500 will make a new all-time high, breaking the hearts of the bears, while energizing the bulls. However, it will be a bull trap, tricking investors. If the pattern continues to play out, the S&P 500 is due for a major collapse in the coming 12-18 months.
Note the chart above that shows the similarities between 2024 and 2007.
This article is intended for informational and educational purposes only and does not constitute financial advice. All trading involves risk. Past performance is not indicative of future results. Trading involves substantial risk. All content is for educational purposes only and should not be considered financial advice or recommendations to buy or sell any asset.
Trading involves substantial risk. All content is for educational purposes only and should not be considered financial advice or recommendations to buy or sell any asset. Read full terms of service.


