The Power Of A Measured Move In Chart Trading

Within the markets, human psychology looms large. Every up and down move in an asset price is driven by fear or greed. While investors do not realize it, symmetry is an important thing to us all. Just like the symmetry of a human body and most things in nature, humans believe max beauty and completeness are when things look symmetrical.
This is where the beauty of a measured move comes in. Investors naturally are predisposed to sell or buy an asset when it has completed a measured move. This is subconscious as investors don’t know that the measured move has completed, it just naturally triggers the underlying feeling of completeness within investors.
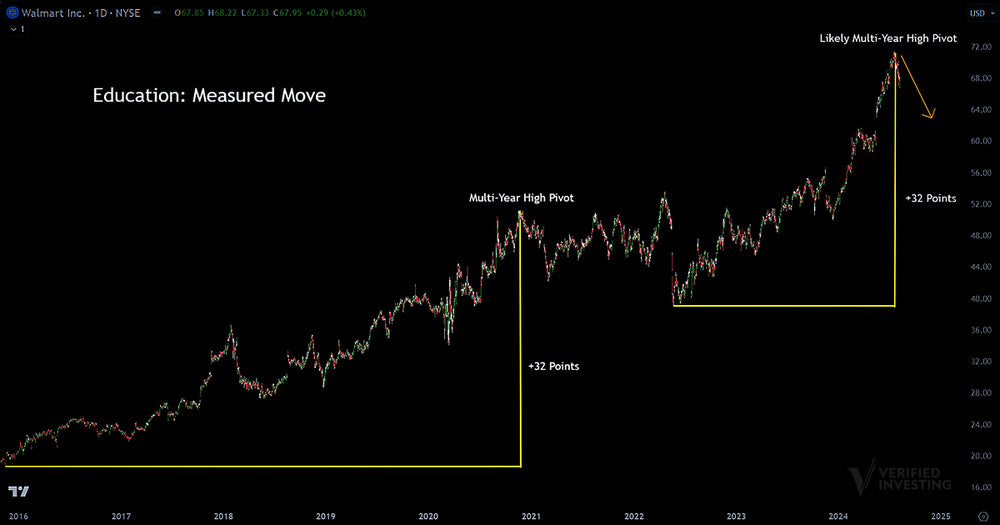
A great example of this is in the Walmart (WMT) chart below. Walmart had a $32 point move from its bull run low to high, that lasted from 2015 to 2020. This was a major pivot low to major pivot high, a complete move. Walmart then went into sideways chop (consolidation) for a period of 18 months. At this point, the stock began its next move up, which measures exactly $32/shares from low to high. This is a measured move.
Investors should note how the stock has already pulled back from that perfect measured move. Based on history, this is likely a major top that will at least last for 18 months and could see a significant correction.
Trading involves substantial risk. All content is for educational purposes only and should not be considered financial advice or recommendations to buy or sell any asset. Read full terms of service.


