CPI Data Charts & Analysis - Inflation
The CPI data is the most important inflation gauge for investors. This stands for Consumer Price Index. It is the inflation that the consumer sees. It is made up of a basket of goods and tracks their monthly and yearly price changes.
The United States is coming off of one of its hottest inflation periods since the 1970's. It has resulted in the most aggressive rate hiking cycle by the Federal Reserve since Volker in the 70's.
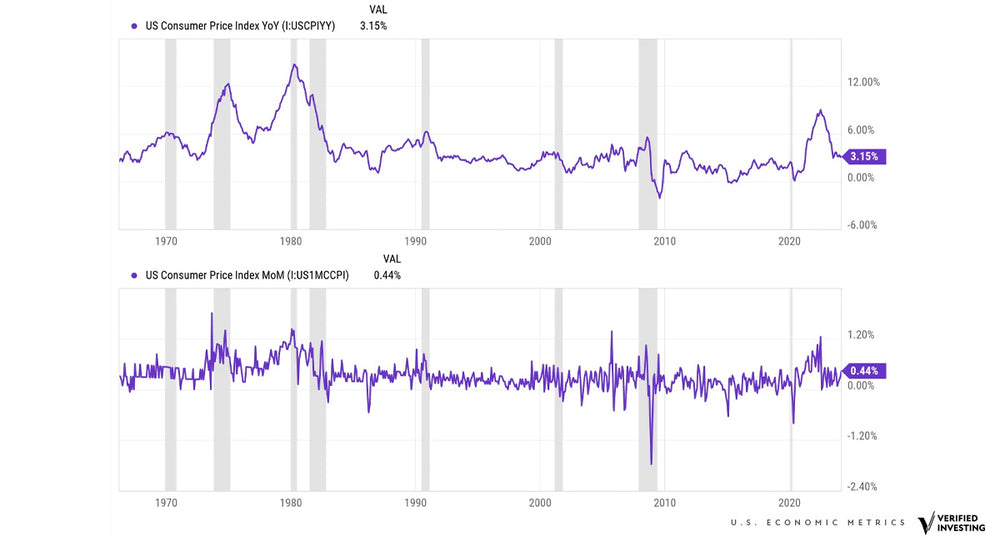
While inflation has declined from a high of 9% (Year over Year) in June of 2022, a strong labor market and liquidity in the system has halted the drop. CPI data over the last months has started to increase again, keeping the inflation rate north of 3%, far above the 2% the Federal Reserve has proclaimed its target level.
In the chart CPI data is shown from the 1960s to current in both year over year and month over month.
Part of the issue with inflation is that the job market has stayed extremely strong keeping consumers spending. Falling inflation significantly relies on a consumer has less money. This changes the supply/demand curve. With oversupply of goods, prices have to fall to increase demand. That is not happening.
The next CPI report is due on April 10th, 2024.
This article is published for educational and informational purposes only. Nothing contained herein constitutes investment advice or a recommendation to buy or sell any security. Please consult a qualified financial professional before making any investment decisions.
Trading involves substantial risk. All content is for educational purposes only and should not be considered financial advice or recommendations to buy or sell any asset. Read full terms of service.


