US GDP Charts And Analysis

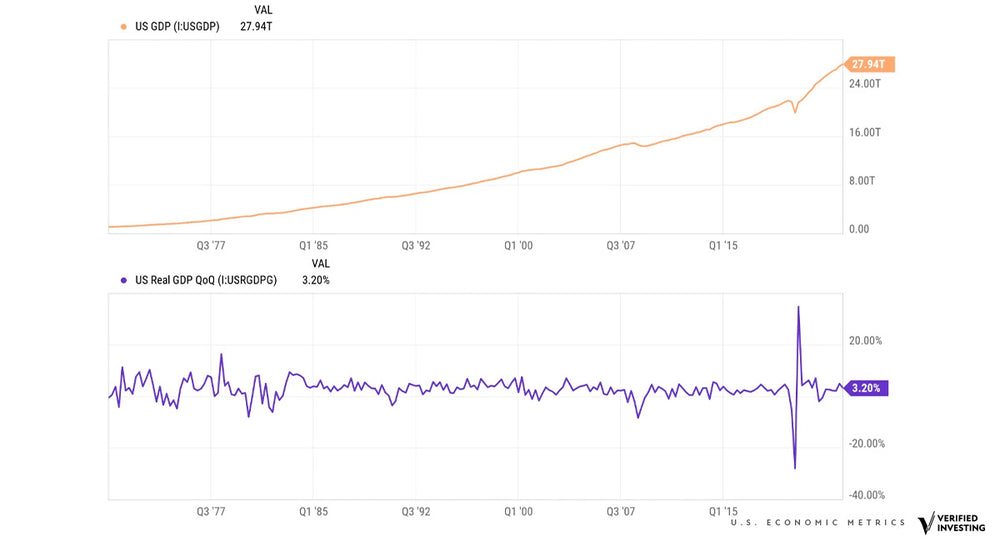
The United States GDP is currently 27.94 trillion. Just prior to the covid, it was 22 trillion and before the financial crisis of 2008-09 it was 14.90 trillion. Based on these metrics, the US economy has almost doubled since prior to the financial crisis.
Growth in terms of GDP in the United States has been consistent aside from recession. However, since 2009, questions remain over how much of the growth is artificial due to money printing, low interest rates and government debt. There is little doubt the economy is juiced when money is free or almost free and pumping into the system, all while massive government debt is being taken on.
The question remains, what will happen if inflation remains high, government borrowing costs continue to swell, the Federal Reserve can not lower rates substantially. The fear is stagflation, where high inflation persists but the economy has a recession.
Stagflation is the worst scenario of all. Usually when inflation is high it is because the economy is strong. In this case, consumers have enough money to handle inflation. If inflation occurs when the economy is faltering, the impact on citizens is extremely hurtful.
First quarter GDP will next be reported on April 25th, 2024. The last reading for fourth quarter 2023 was 3.2%.
Trading involves substantial risk. All content is for educational purposes only and should not be considered financial advice or recommendations to buy or sell any asset. Read full terms of service.


