10 Year Yield Chart Signals Move To 3.87% On Economic Weakness
Published At: May 25, 2024 by
Gareth Soloway

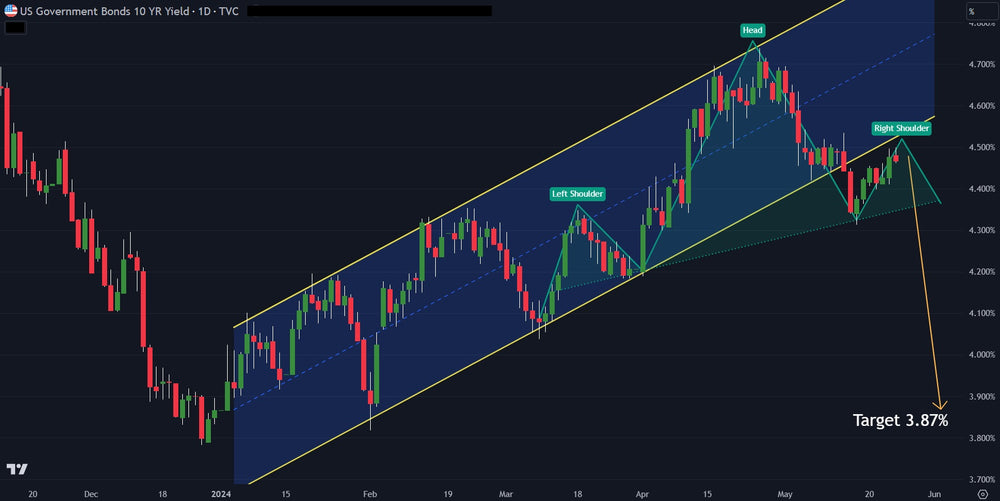
The 10 year yield has broken below an up-sloping channel. This is bearish. Price is now consolidating in a bear flag, setting up for another leg lower.
In addition, there is a head and shoulder pattern forming on the 10 year yield. This is an additional bearish pattern.
The two pattern formations together set an ominous tone for yields. If the head and shoulders plays out to target, yields on the 10 year are headed to 3.87%.
Trading involves substantial risk. All content is for educational purposes only and should not be considered financial advice or recommendations to buy or sell any asset. Read full terms of service.


