GAME PLAN REVEALED: 07/24/2025

With Gareth Soloway out of the office, Drew Dosek stepped in to helm this morning’s GAME PLAN, guiding traders through a market buzzing with high-profile earnings reports and renewed meme stock fervor. The morning was packed with action, from major beats and misses from titans like Google and Tesla to intriguing breakouts in airline and retail stocks. Today's analysis revealed a complex market environment where headline numbers don't always tell the full story, and technical patterns are providing a much-needed roadmap.
This article will expand on the critical themes from the show, offering deeper context on the paradoxical nature of this earnings season, the power of specific chart patterns, and the important divergences appearing across the major indices.
The Earnings Season Paradox: When Good News Isn't Good Enough
One of the most crucial takeaways from this morning's analysis is a theme that has defined this earnings season: strong historical performance is being overshadowed by future uncertainty. Several companies reported impressive "double beats"—exceeding analyst expectations for both revenue and earnings per share—only to see their stock prices fall.
As Drew Dosek explained, “This earning season is different than ones in the past. A lot of companies are having double beats much like IBM, but guidance is being altered for the future or even being taken away and that's giving, uh, investors uncertainty and they're hitting the sell button.”
This highlights a fundamental truth of investing: markets are forward-looking mechanisms. Past success is already priced in; it's the outlook that drives price action. We saw this play out across multiple sectors:
- IBM (IBM): Despite a double beat, the stock sold off. This reaction underscores how any hint of caution in a company's forward guidance can spook investors, especially in a market priced for perfection. For traders watching the fallout, the first major support level to watch is at $255.33, which could offer an intraday bounce. A more conservative, longer-term swing trade setup would require patience, waiting for a potential drop to $225.15.
- American Airlines (AAL): Here again, a double beat on earnings was met with selling pressure. The stock is now approaching a critical confluence of support at $11.48, where an inclining trendline meets a gap fill. This trendline has been tested three times, making it vulnerable. A break below this level could open the door to a significant drop toward the $10 range.
- Tesla (TSLA): Tesla also delivered a double beat, but CEO Elon Musk’s commentary cast a shadow over the results. He warned of potentially "tough quarters ahead" due to the loss of a key EV tax credit. This forward-looking statement immediately soured sentiment, causing the stock to break down from a wedge pattern. The immediate intraday support is the gap fill at $295.88, with more significant long-term trendline support around $282.
- Chipotle (CMG): In contrast to the others, Chipotle missed on revenue and explicitly stated that "consumer sentiment was weakening." This direct confirmation of economic headwinds sent the stock tumbling to $45.80. The key intraday support level is $44.46, but a more substantial swing trading opportunity may present itself closer to the bottom of its parallel channel, near $41.65.
This earnings season is a masterclass in reading between the lines. It's not just about the numbers; it's about the narrative, the guidance, and the macroeconomic context that will shape future performance.
Decoding the Inverse Head & Shoulders: A High-Probability Setup
Amid the earnings chaos, a powerful bullish reversal pattern has emerged on several charts: the inverse head and shoulders. This pattern, consisting of a central low (the head) flanked by two slightly higher lows (the shoulders), signals a potential bottom and the start of a new uptrend once price breaks above the "neckline" connecting the peaks.
Drew highlighted why this pattern is a favorite among technical traders: “Those patterns are awesome. They're really a low risk high reward pattern because you can play these for any sort of pullbacks down to the neckline.” The strategy is clear: buy on a pullback to the confirmed neckline, place a stop-loss just below it, and target the "measured move"—the height of the pattern projected upward from the breakout point.
Several stocks are currently displaying this compelling setup:
- PDD Holdings (PDD): The former Chinese e-commerce giant, now based in Ireland, has broken out from a declining trendline that also forms the neckline of a clean inverse head and shoulders pattern. While the stock is overbought in the short term, a pullback to the neckline around $111.46 would present a textbook buying opportunity. The measured move target for this pattern points to a potential rally to $147.44, offering over 24% upside from recent levels.
- Southwest Airlines (LUV): Despite a double miss on earnings, the power of the technical pattern is holding firm. LUV has a confirmed inverse head and shoulders pattern, meaning any weakness that brings the price back to the neckline support at $34.10 should be viewed as a buying opportunity. As long as the price holds above this level, the measured move target remains a very attractive $45.77.
- iQIYI, Inc. (IQ): This chart shows an inverse head and shoulders pattern that has already accomplished its initial measured move, kissing the $2.13 target. However, the breakout from the long-term declining trendline was powerful, suggesting more upside could be in store. While aggressive traders could enter now, a more conservative approach would be to wait for a pullback to support levels at $1.99 or the original trendline break around $1.92, with an ultimate target closer to the $3 range.
A Market Divided: Index Divergence Signals Caution
While individual stocks are making dramatic moves, the broad market indices are telling a story of divergence and potential exhaustion. The major indices are not moving in lockstep, which is often a sign of a maturing rally and potential sector rotation.
- S&P 500 (SPX): The benchmark index is in an extended uptrend and is now creeping toward major resistance at the top of an inclining parallel channel, right around the 6,400 level. With the RSI indicator deeply in overbought territory, the market is stretched. As Drew noted, "We need some sort of correction. A 5% pullback would put us just slightly above 6,000 right here on this pivot point."
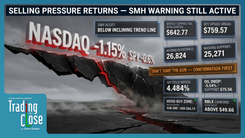
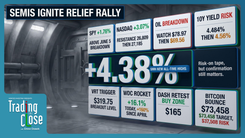
- Semiconductors (SMH): The high-flying semiconductor sector is showing clear signs of fatigue. The SMH chart is displaying a "curling over pattern" after being rejected by its own inclining parallel channel. After a month of sideways chop, the path of least resistance appears to be lower, with key support levels at $265.51 and $258.03.
- Russell 2000 (IWM): In stark contrast, the small-cap index has been showing relative strength. It recently pushed above a key pivot high and is undergoing what appears to be "bullish consolidation." If the IWM can regain its footing and close strong, it would be a powerful signal for this segment of the market, suggesting money may be rotating out of over-extended large caps and into small caps.
- Nasdaq 100 (QQQ): The tech-heavy QQQ remains resilient but is currently trapped between two trendlines, unable to make a decisive move up or down. Its fate will likely be tied to the resolution we see in the broader market.
This divergence—a tired SPX and SMH, a strong IWM, and a trapped QQQ—warrants caution. It suggests the market's advance is narrowing, a condition that often precedes pullbacks or corrections.
The Outliers: Google's Strength and AEO's Meme-Fueled Breakout
Not every stock followed the "sell the beat" narrative. Google (GOOGL) stood out as a beacon of strength. After its own double beat, the stock pushed higher because the company announced it would be increasing spending on new ventures. Investors cheered this news of reinvestment, seeing it as a sign of future growth. As a relative laggard compared to other tech giants, Google has room to run, with the next major resistance at the 50% line of its parallel channel, right at $200.05.
Meanwhile, a different kind of excitement is brewing in the retail space. American Eagle Outfitters (AEO) has become the latest stock to join the "meme craze," seeing an explosive move higher. However, this may be different from other recent fads. AEO's rally is backed by a fundamental catalyst: a new campaign with actress Sydney Sweeney. As Drew mentioned, "This could actually have some sticking power with the younger generation."
Technically, AEO has broken out of a long-term declining trendline. The strategy here is to wait for a pullback into the support zone created by market chop between $10.60 and $11.00. For those already in the trade, the first resistance target is $13.32, followed by $15.83.
Crypto & Commodities: A Time for Patience
Away from the equity markets, key assets in the crypto and commodity space are signaling a need for patience as they consolidate and pull back.
- Bitcoin (BTC): After putting in a significant weekly and daily topping tail, Bitcoin has been consolidating. This price action has formed a near-term bear flag pattern, which typically resolves to the downside. A pullback to the support level at $113,278 seems likely.
- Gold & Silver: Both precious metals are pulling back. Gold was rejected from a declining trendline and is now back inside a wedge pattern, with major support at $3,286.47. Silver is also retreating after a great run that accomplished the measured move from its own inverse head and shoulders pattern. It has near-term support at $36.58, with a more significant trendline support currently around $33.63.
- Oil & Natural Gas: U.S. Oil remains in a bearish consolidation pattern, with a long-term target near the $60 mark. Natural Gas is seeing a slight bounce after three days of heavy selling, but a failure to get back into its previous wedge pattern would likely see it test lower support levels at $3.00 and $2.55.
Conclusion: Navigating a Complex and Divergent Market
Today's market is a puzzle of conflicting signals. We have an earnings season where strong results are punished due to future fears, powerful bullish patterns forming in select stocks, and major indices that are diverging and showing signs of exhaustion.
In this environment, a disciplined, technical-based approach is more valuable than ever. By focusing on multi-factor support and resistance levels, identifying high-probability patterns like the inverse head and shoulders, and respecting the market's forward-looking nature, traders can cut through the noise. The key is patience—waiting for price to come to predefined levels—and agility, recognizing that the themes driving one sector may not apply to another. As the week continues, the levels and patterns identified today will serve as a crucial roadmap for navigating the opportunities and risks ahead.
Trading involves substantial risk. All content is for educational purposes only and should not be considered financial advice or recommendations to buy or sell any asset. Read full terms of service.