My Trading Game Plan Revealed - 01/14/2026: S&P Wedge Break Looms as Rates Rise and AI Data Center Power Risk

The market is sending conflicting signals. While inflation data from the Producer Price Index (PPI) came in relatively benign, a look at the commodity markets tells a different story. Copper is at an all-time high, and silver just made a massive overnight move, nearing $92 USD per ounce. These are undeniable inflationary pressures that the market seems to be sniffing out, despite what the headline data suggests. This tension was evident yesterday as an initial rally faded into a negative close. In this morning's My Trading Game Plan, Gareth Soloway, Chief Market Strategist at Verified Investing, broke down the critical chart patterns that show the market is being squeezed into a corner, forcing a major directional move in the very near future.
The S&P 500's Inevitable Breakout
The broad market, represented by the S&P 500, is caught in a technical vise. For weeks, price action has been coiling tighter and tighter within a classic wedge pattern. This morning, the S&P 500 futures are trading lower around 6,973, down from yesterday's close near 7,000, continuing the compression.
A wedge pattern is formed by converging trendlines, one ascending and one descending, indicating a period of consolidation and indecision. However, this indecision cannot last forever. The apex of the wedge represents a point where a breakout is forced. As Gareth pointed out, that deadline is fast approaching:
"What is the head where we have to, where markets will be forced to break? That's on February 3rd. So by February 3rd or before, this market will decide which way it wants to go."
While a break to the upside could trigger a short-term momentum squeeze, the probabilities favor a more significant move to the downside. The market is incredibly extended after a multi-month rally, and a break of the lower trendline would likely unleash significant pent-up selling pressure. This isn't just an S&P 500 story; the Dow Jones Industrial Average is also pressing against a key trendline from 2023, and the Russell 2000 showed significant weakness yesterday, closing back below its own major trendline after a brief morning pop. The entire market is signaling that a major move is imminent.
The Leverage-Fueled Risk in the Nasdaq
While the broader indices are showing signs of strain, the tech-heavy Nasdaq presents a particularly precarious setup. It is currently hammering on a critical trendline that has supported its advance. The danger here is not just a simple breakdown, but the potential for a rapid, cascading sell-off.
"The problem with this is that if it breaks or when it breaks, it's likely going to trigger a momentum flush out… the flush outs occur when there's too much leverage in the system."
This concept of a "momentum flush out" is crucial for traders to understand. When a market has experienced a prolonged, one-sided rally, traders often become complacent and use excessive leverage to maximize gains. When a key technical level finally breaks, it triggers a wave of forced selling as margin calls are issued and leveraged positions are liquidated. This creates a domino effect, pushing prices down much faster and further than they would otherwise go. While true market crashes are rare, these deleveraging events can be swift and brutal, and the Nasdaq's current technical posture suggests it is vulnerable to just such an event.
The Looming Catalyst: Interest Rates and a Bull Flag
If the market is a coiled spring, what could be the catalyst that triggers its release? All eyes should be on the U.S. 10-year Treasury yield. The chart of the 10-year yield is forming one of the longest and most well-defined bull flag patterns in recent memory. A bull flag is a continuation pattern that suggests a period of consolidation (the flag) will be followed by another sharp move higher (a continuation of the flagpole).
Gareth's analysis suggests a powerful inverse correlation is about to reassert itself: "It makes sense to me that when this breaks out, that could be the trigger where we see the S&P, the NASDAQ, and these other indices start breaking down."
Historically, sharply rising interest rates act as gravity on stock valuations, particularly for growth-oriented tech companies. A breakout in the 10-year yield could be driven by persistent inflation (as suggested by commodities), growing unease about the U.S. debt situation, or concerns about the Federal Reserve's independence. Further supporting this thesis is the Japanese 10-year yield, which is often a leading indicator for U.S. rates and is already beginning to tick higher.
Cracks Appear in the AI Narrative
For the past year, the artificial intelligence narrative has been the primary engine of the market's advance. However, a major fundamental headwind is now emerging that threatens to derail the entire trade. The immense energy requirements of AI data centers are colliding with the reality of an insufficient power grid.
The government is finally taking notice. As Gareth has been warning for months, the prospect of data centers draining the public grid and causing electricity bills to "double, triple, quadruple" is becoming a political issue. The President has signaled that this will not be allowed, which has profound implications:
- Slower Build-Out: The pace of data center construction will inevitably slow down as companies are forced to find alternative, and more expensive, power sources.
- Obsolete Hardware: Companies like Oracle have borrowed billions to purchase AI chips from NVIDIA. If these chips sit in a warehouse for years waiting for a data center to be powered, they could become obsolete before ever generating a return. This turns a massive investment into "dead debt."
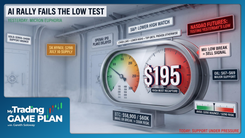
This narrative shift is already being reflected in the charts. Salesforce (CRM) fell 7% yesterday on these concerns. Gareth is watching for a potential swing trade entry near the $193 pivot low, a level that represents a "retrace to the scene of the crime"—a common technical pattern where price returns to test a former breakout point. Microsoft is also showing extreme weakness, with a feeble bounce after a double top, and looks poised to break a key trendline and head much lower.
Commodities: Inflation Warnings and Signs of Exhaustion
The commodity complex is flashing critical signals for traders. Silver has been on an absolutely incredible run, exploding higher to the top of its parallel channel. However, as it tests resistance near $93 USD per ounce, a warning sign has appeared.
"You have a high, higher high [on the price chart] and a low, lower low on the RSI. And so this is the first time we're really seeing that divergence in the price of silver via the RSI. It just does put me on alert."
This is a classic negative divergence, where price makes a new high but the momentum indicator (RSI) fails to confirm it, suggesting the trend is losing strength. A similar short-term negative divergence is also appearing in gold, even as it pushes towards a potential $5,000 USD per ounce target. For long-term holders, this may be noise, but for swing traders, it's a crucial signal to be cautious and manage risk.
Meanwhile, oil has had a powerful five-day rally after its recent breakout. The healthiest action now would be a period of sideways consolidation to build energy for the next leg higher. This mimics human nature; just as a runner needs to rest and refuel during a marathon, a financial chart needs to consolidate after a strong move before it can continue its trend.
Natural Gas: A Contrarian Long-Term Opportunity?
While the short-term chart for natural gas remains weak, testing support around the $2.74 to $2.75 USD level, the emerging data center power crisis presents a fascinating long-term thesis. If data centers are barred from the main electrical grid, how will they power themselves?
"Natural gas is probably the most likely one… if your outlook is, let's say, 3, 6, 9, 12 months, I actually think there might be some positivity here on natural gas from a data center perspective."
This is a brilliant example of second-level thinking. The same headwind that is bearish for AI and data center stocks could become a powerful, long-term tailwind for natural gas demand. While the near-term price action is bearish, savvy investors should be on alert for a potential long-term investment opportunity as this new demand dynamic begins to take shape over the next 6 to 12 months.
Conclusion: A Market at a Crossroads
The market is wound tight. The S&P 500 is trapped in a wedge that must resolve by early February, with probabilities favoring a downside break. The Nasdaq is laden with leverage, making it vulnerable to a sharp deleveraging event. All of this is happening as a potential catalyst—a breakout in interest rates—is forming a textbook bull flag pattern.
Underlying these technical tensions, the fundamental narrative that has driven the market is beginning to crack, with the AI data center boom facing a significant power-grid reality check. As we await the market's next major move, traders must remain disciplined, watch the key levels on the indices and the 10-year yield, and pay close attention to the early warnings being sent by the commodity markets. The period of calm and compression is ending, and the time for a decisive move is just around the corner.
Trading involves substantial risk. All content is for educational purposes only and should not be considered financial advice or recommendations to buy or sell any asset. Read full terms of service.