My Trading Game Plan Revealed - 02/27/2026: Hot PPI, AI Layoffs and S&P Distribution Signal Market Risk

The economic landscape shifted dramatically this morning as inflation data roared back into the headlines, challenging the prevailing narrative of a "soft landing." With Producer Price Index (PPI) numbers coming in significantly hotter than expected, and major tech companies signaling a massive shift in labor dynamics due to Artificial Intelligence, the markets are facing a dual threat of stagflation and structural unemployment. In this morning’s My Trading Game Plan, Gareth Soloway, Chief Market Strategist at VerifiedInvesting.com, broke down the critical data points, the "distribution" patterns in the S&P 500, and the specific trade setups emerging from this volatility.
The Return of Inflation: A Stagflationary Warning
The market has been operating under the assumption that inflation is on a glide path down to 2%, but today's data suggests a starkly different reality. The PPI year-over-year numbers came in at 2.9% versus expectations of 2.6%, while month-over-month numbers hit +0.5% against a forecasted 0.3%. Even more concerning is the core data—excluding food and energy—which confirms that inflation is entrenched in the broader economy.
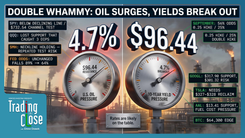
This resurgence is visible across the spectrum of input costs. We are seeing multi-year or all-time highs in commodities ranging from gold, silver, platinum, and palladium to live cattle. Oil prices alone spiked 15% in January. As Gareth warned, "Inflation is not going back to 2%. It is not."
This data creates a nightmare scenario for the Federal Reserve and the incoming Chair. The market is now staring down the barrel of stagflation—a period of stagnant economic growth coupled with high inflation. This puts immense pressure on equity markets, as the central bank’s ability to cut rates to support a slowing economy becomes severely constrained by rising prices.
The AI Disruption: Block and the Labor Market
Beyond the macroeconomic data, a structural shift is occurring in the labor market that carries profound long-term implications. Block (formerly Square) surged roughly 20% today, but the catalyst for this move is what demands attention: the company announced it is laying off 50% of its employees to pivot toward AI-driven efficiency.
While the stock market initially cheers the cost-cutting, this signals a dangerous trend for the consumer economy. Block is not an isolated case; it is a precursor. As major tech conglomerates invest hundreds of billions into AI infrastructure, the ultimate goal is automation and labor reduction. Gareth highlighted a grim irony in this cycle: consumers will likely face higher electricity bills to power the very data centers that are rendering their jobs obsolete.
From a trading perspective, this introduces a new variable of instability. While AI drives efficiency, the potential for higher unemployment could erode the consumer spending power that underpins corporate earnings. This disconnect between short-term corporate efficiency and long-term economic health is a narrative that traders must monitor closely.
S&P 500 Technicals: The Distribution Phase
Turning to the technicals, the S&P 500 is exhibiting classic signs of a market top. By connecting the 2020 lows to the 2021 bull market highs using a parallel channel, we can see the index is currently grinding against a major resistance point.
This price action over the last six months represents a "rounded top," a pattern often associated with institutional distribution. While retail investors continue to buy the dip, believing the market cannot go down, institutional money is using this liquidity to offload positions. This transfer of risk from "smart money" to "dumb money" is a hallmark of a market peak.
Critical Breakdown Levels
The immediate technical setup on the S&P 500 is a head and shoulders pattern, with a critical support line that traders must watch.
"This is your break point right down here, right around 6,790. If that breaks, we should hop, skip, and jump straight down here over the course of next week."
With the market closing yesterday around 6,908, a break of this magnitude would require a drop of roughly 110 to 120 points. However, if this level gives way, the technical damage would likely trigger a rapid descent. The confluence of this technical breakdown with the hot PPI data creates a high-probability scenario for further downside.
The Bond Market Signal: Bad News is Bad News
Perhaps the most alarming signal is coming from the bond market. In a typical environment, hot inflation data should send yields higher, as traders price in a more hawkish Federal Reserve. However, the 10-year Treasury yield is dumping, dropping below 4% today.
This divergence is critical. It suggests that the bond market believes the economy is deteriorating so rapidly that inflation numbers won't matter—the Fed will be forced to lower rates regardless. When yields collapse in the face of rising inflation, it indicates that the market is pricing in a severe economic slowdown or recession in the next 6 to 12 months.
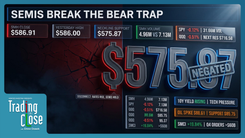
Nvidia and the Chip Sector: A Bear Market Behavior
Nvidia, the bellwether of the current market cycle, provided a textbook example of "bear market behavior" following its recent earnings. Despite beating earnings and revenue estimates and raising guidance massively, the stock sold off 5.5% yesterday and is down another $15 today to trade around $181.
"Great news, and the stocks still go down. What kind of market is that? That's a bear market."
When a stock fails to rally on perfect news, it indicates that the good news is fully priced in and sentiment has shifted. Technically, Nvidia is threatening to break a key trendline at $175. If this level fails, the next major support zone is significantly lower. Gareth has set a mid-year target for Nvidia at approximately $150, which would likely serve as a strong support level for a potential swing trade long.
This weakness is echoed elsewhere in the sector. CoreWeave, another chip-related name, is forming a bear flag pattern after getting slammed on earnings. While a gap fill at $74.50 might offer a day trade bounce, the prevailing technical structure suggests lower prices ahead.
Opportunity in Oversold Conditions: Duolingo
While the broader market looks precarious, volatility creates specific opportunities for disciplined traders. Duolingo stands out as a compelling swing trade setup on the long side.
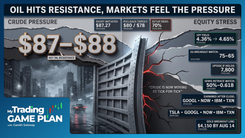
The stock has witnessed a catastrophic decline, falling from $545 just nine months ago to approximately $86 today. This massive depreciation has pushed the stock into deep oversold territory. Currently, it is sitting on a major support shelf between $80 and $88, coinciding with a gap fill level.
Trading is about probability, not certainty. When a stock is this oversold and hits a structural support zone, the probability of a sharp relief bounce increases significantly. A move from $86 back to $100 is a realistic technical expectation, even if the long-term trend remains bearish. This distinguishes a "trade" from an "investment"—the goal is to capture the technical reaction, not to marry the stock.
Commodities: Silver, Gold, and Oil
The commodity complex continues to signal inflationary pressure and geopolitical risk.
- Silver: Silver is currently testing the upper range of its resistance between $92 and $93. A breakout here could trigger a squeeze toward $100. However, the longer-term chart still suggests a potential retracement to $50 later in the cycle, particularly if the economic slowdown accelerates.
- Gold: Gold continues to hold firm, with potential upside targets around $5,400 as it acts as a hedge against both inflation and currency debasement.
- Crude Oil: Oil prices are popping today, likely driven by fears of an imminent military conflict involving Iran. With the deadline for negotiations approaching, the market is pricing in a geopolitical risk premium.
Conclusion: Navigating a High-Risk Environment
The combination of hot inflation, a deteriorating labor outlook, and bearish technical patterns on major indices paints a cautionary picture for the weeks ahead. The disconnect between retail optimism and institutional distribution is reaching a critical juncture.
However, as Gareth emphasized, "The chart is the chart." By ignoring the noise and focusing on specific levels—whether it's the breakdown level on the S&P 500 at 6,790, the buy zone for Duolingo at $86, or the short target for Nvidia at $150—traders can navigate this volatility with a probability-based mindset.
In an environment where "bad news is bad news" and good corporate news results in sell-offs, discipline is paramount. The market is revealing its hand through price action; the key is to listen to what the charts are saying rather than what the headlines are hoping for.
Trading involves substantial risk. All content is for educational purposes only and should not be considered financial advice or recommendations to buy or sell any asset. Read full terms of service.