My Trading Game Plan Revealed - 03/05/2026: S&P 500 Breakdown Risk, Fed Delay, Oil Rally and AI Stock Weakness

In this morning’s My Trading Game Plan show, Gareth Soloway, Chief Market Strategist at Verified Investing, delivered a sobering reality check to the bulls celebrating yesterday’s market rally. While the headlines cheer the green on the screen, the technical undercurrents tell a different story—one of hidden weakness, rising inflationary pressures, and a potential credit crisis lurking in the shadows.
As we navigate the first quarter of 2026, the divergence between market narratives and technical reality is widening. Today’s analysis breaks down the critical support levels on the S&P 500, the warning signs flashing in the semiconductor sector, and the shifting expectations for Federal Reserve policy that could derail the bullish thesis.
The S&P 500: Breadcrumbs of a Breakdown
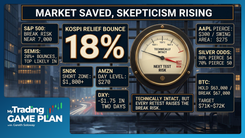
The S&P 500 staged a rally yesterday, closing higher and momentarily soothing investor anxiety. However, seasoned technicians know that one day of green does not negate a structural downtrend. The index is currently exhibiting a classic pattern of lower highs and lower lows—a series of "breadcrumbs" that the market leaves for those disciplined enough to look beyond the hype.
The most critical level on the board right now is the trendline support at roughly 6,790 on the S&P futures. This level has been the line in the sand for nearly a month. While the market has successfully tested and bounced off this level repeatedly, including the dip earlier this week, the repeated hammering on support weakens the structure.
Gareth warned of the psychological trap currently being set:
"It's continuing to lure us into this false sense of it can never go down… But look what's going on here. You have a high, lower high, lower high… And in actuality, low, slightly lower low, lower low, lower low."
The danger lies in complacency. When a major trendline like 6,790 finally breaks after multiple tests, it rarely results in a gentle decline. Historically, such breaks trigger a flush—a rapid liquidation event where the market could drop 5% to 10% in a matter of one to two weeks. Traders must remain vigilant; as long as the index holds above this level, the illusion of stability remains, but a daily close below it signals a significant shift in market character.
The AI Trade: Selling into Strength
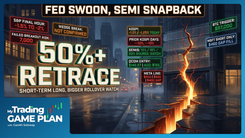
A concerning development for the broader tech sector is the price action in AI darlings like Broadcom (AVGO). Despite reporting earnings and seeing an initial pop, the stock is showing signs of distribution. The rally is fading, suggesting that institutional players are using liquidity events to offload positions rather than accumulate new ones.
This behavior points to a saturation in the AI trade. As more companies rush to produce AI chips, margins inevitably contract, and the explosive growth priced into these stocks begins to normalize.
Technically, Broadcom is forming a precarious setup. While it may bounce toward the $330 area, the rally lacks robustness. The critical level to watch is the gap fill at $306. A break below this level would be technically catastrophic, likely opening the door for a slide down to $250.
This weakness is mirrored in the Nasdaq futures. The index is currently trading lower, and like the S&P, it sits atop a precipice. The key breakdown level for the Nasdaq is approximately 22,275. A violation of this support would likely trigger a 12% decline toward the 20,000 mark. The message from the charts is clear: the "Magnificent Seven" are tired, and without their leadership, the market’s foundation is crumbling.
The Macro Underbelly: Oil, Yields, and the Delayed Fed
While equity traders focus on daily price swings, the macro environment is shifting in ways that are hostile to high asset prices. The most immediate concern is the resurgence of inflation expectations, driven largely by the energy sector.
Oil: The 2026 Outperformer
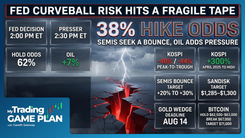
As predicted at the start of the year, oil has been the standout asset of 2026, up roughly 40% year-to-date. Currently trading around $77 per barrel, oil is catching up to other inflation-adjusted assets like gold and copper. This rotation into energy is a classic late-cycle institutional move—money managers rarely go to cash; they simply rotate into sectors that benefit from the prevailing economic winds.
However, the rally in oil may be nearing a tactical exhaustion point. Gareth identified a potential shorting opportunity between $80 and $81 per barrel. With the U.S. midterm elections approaching in November, political pressure to lower gas prices will likely result in a concerted effort to cap oil prices, potentially driving them back down to the high $60s or low $70s later in the year.
The Bond Market’s Warning
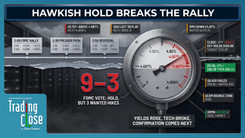
The bond market is screaming that inflation is not dead. The 10-year Treasury yield has surged from a low of 3.92% to a high of 4.14% today. This rapid ascent indicates that the market is pricing in higher-for-longer inflation.
This move in yields has profound implications for Federal Reserve policy. Just a few months ago, the market anticipated rate cuts early in the tenure of the new Fed regime. Today, the Verified Investing FedWatch tool shows that expectations for the first rate cut have been pushed all the way back to September 2026.
"Now, it's pushing it off to September because inflation expectations are being ratcheted up."
This delay removes a key pillar of support for equity valuations. If the "Fed put" is effectively removed until the fall, the market must stand on its own fundamentals—fundamentals that are currently eroding due to a private credit crisis.
The Private Credit Crisis
Beyond the headlines, a silent crisis is brewing in private credit. Banks are beginning to take massive write-downs, and loan losses are mounting. Defaults on credit cards and auto loans are spiking, signaling distress in the consumer economy. This "underbelly" of the market is what keeps prudent strategists up at night. While oil prices grab the attention, the systemic risk lies in the credit markets, where leverage and defaults can trigger a cascade of financial stress.
Precious Metals: Short-Term Caution, Long-Term Insurance
The precious metals complex is exhibiting a divergence between short-term technical patterns and long-term fundamental value. Both gold and silver are pausing after recent moves, flashing warning signs for short-term traders.
Gold is potentially forming a bear flag pattern—a consolidation following a downward move that typically resolves lower. Similarly, silver was rejected at the $92-$93 resistance zone and is printing inside bars. If silver breaks down, support awaits at the $70-$71 level.
However, it is crucial to distinguish between trading setups and investment theses. Gareth emphasized that despite the short-term bearish technicals, he retains his long-term physical holdings.
"I'm still holding my long-term gold holdings… it's like an insurance policy against a slow-moving train wreck, which is the state of the US in terms of its debt."
For traders, the play is to be cautious of a near-term pullback. For investors, the thesis of gold as a hedge against fiat currency debasement remains intact.
Earnings Movers: Valuation Matters
Two stocks moving on earnings today—The Trade Desk (TTD) and JD.com (JD)—perfectly illustrate the importance of valuation and technical location.
The Trade Desk: The Power of Buying Low
The Trade Desk surged nearly 25% today following news of a partnership with OpenAI. While the news is the catalyst, the technical setup was the fuel. The stock had been beaten down to levels not seen since the COVID lows of 2020. Trading at a P/E of 10-12 for a software growth stock, it was fundamentally undervalued and technically oversold.
This move validates the strategy of buying quality assets when they are hated and trading at historical support. However, chasing the stock up here at $35-$36 resistance is dangerous. The easy money has been made, and while a short squeeze could push it higher, the risk-reward profile has shifted.
JD.com: A Day Trade Opportunity
Conversely, JD.com is gapping down on earnings, presenting a potential "falling knife" opportunity for skilled day traders. The stock is trading near the lower end of its chart, and Gareth identified a specific level of interest at $24. This level coincides with a previous pivot low and a resistance-turned-support zone.
If the $24 level fails to hold, the next major support is the gap fill at $21.40. In a market where volatility is increasing, these precise technical levels allow traders to execute with defined risk, rather than gambling on headlines.
Conclusion: Discipline Over Hopium
The current market environment is characterized by a dangerous disconnect. Bitcoin is breaking out, showing relative strength, while the S&P 500 and Nasdaq teeter on the edge of critical breakdowns. Oil is rallying on inflation fears, while the bond market forces the Fed to keep rates higher for longer.
In such a complex landscape, relying on "hopium"—the hope that a position will turn around—is a recipe for disaster. As Gareth noted:
"What serves you best and will make you more money in life is being honest. And just being aware is an important part of that."
The game plan for the coming days is clear: Watch the 6,790 level on the S&P 500 with hawk-like intensity. Monitor the 10-year yield as it approaches 4.2% resistance. And most importantly, maintain the discipline to wait for trade setups that align with logic and charts, rather than getting swept up in the narrative of a market that "can never go down." The breadcrumbs are there for those willing to see them.
Trading involves substantial risk. All content is for educational purposes only and should not be considered financial advice or recommendations to buy or sell any asset. Read full terms of service.